View full size chart
E-Mini S&P 500 Futures
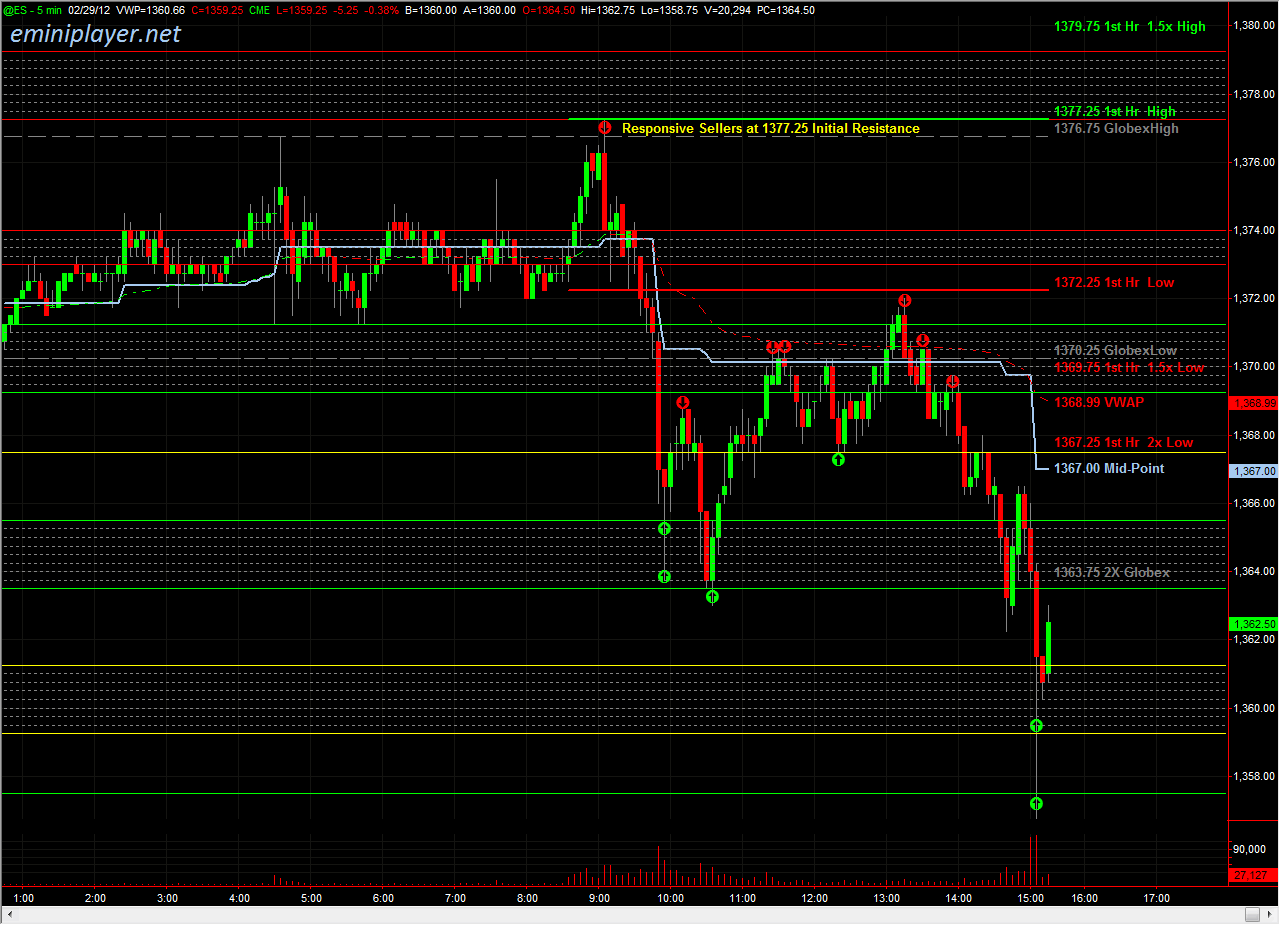
ES held above the 1365.50 Support in the overnight session, and tested the 1372-1374 Resistance where it found Responsive Sellers capping the upside. Heading into the day session, we'll be using 1367.50 as the Micro Bull/Bear Line in Sand as a gauge to see which side is being more aggressive; holding above 1367.50 would indicate Buyers in Control, and holding below would indicate weakness on the Buy side (not necessarily Sellers in Control). We have Initial Support at 1364-1366, followed by the Bull/Bear Zone at 1359.25-1361.25 -- the overall bias remains bullish above that area. On the upside, we have Pre-Market Resistance at 1372-1374 followed by Initial Resistance at 1377.25-1379.25. A pullback off the open would indicate a higher probability of a Balanced Session, with Responsive Sellers active at Resistance and Responsive Buyers active at Support. The primary catalyst during the day session is Consumer Confidence at 9 AM (CT). Use the Opening Range and 1367.50 for short-term bias off the open.
Econ Data
Durable Goods Orders at 7:30 AM (CT), Redbook at 7:55 AM (CT), S&P Case-Shiller HPI at 8:00 AM (CT), Consumer Confidence, Richmond Fed Manufacturing Index and State Street Investor Confidence Index at at 9:00 AM (CT).
Webinar/Live Trading Room: Join us for free at http://bit.ly/z3cmTo


