Showing posts with label February. Show all posts

Saturday, February 11, 2012

E-Mini S&P 500 Futures Trade Plan & Chart for Friday 02/10

Today's EMiniPlayer.net Trade Plan
Yesterday's Review/Analysis post mentioned that we were seeing signs of short-term exhaustion, and price remained below the 1349-1351 Bull/Bear Zone and tagged each of the Support Zones mentioned in the Overnight Session Notes, with Responsive Buyers active on first test of each Zone. Heading into the day session, we'll be using 1335-1336.50 as the Micro Bull/Bear Zone to establish directional bias. Holding above this area will open the door to test 1339-1341 Pre-Market Resistance and 1344.50-1346.50 Initial Resistance, with potential for tagging the gap fill at 1348.25 and the previous VPOC at 1349 as an extreme. A break and hold below 1335-1336.50 would indicate Initiative Sellers active in the market, and bring the 1328.50-1330.50 Initial Support Zone into play as a target. Below that, we have Support at 1326.50 and 1322.50-1324.50. Bigger picture, Buyers remain in Control above 1320 -- Responsive Buyers could shut off the Selling at any of those Support Zones, and then push ES back up to test 1335-1336.50 and 1339-1341. The primary economic catalyst this morning is Consumer Sentiment at 8:55 AM (CT). ES is set to open below Value.

5-min Chart with EMiniPlayer.net Support/Resistance Zones

View full size chart

Thursday, February 9, 2012

E-Mini S&P 500 Futures Trade Plan & Chart for Thursday 02/09

Today's EMiniPlayer.net Trade Plan
Overnight, ES rejected the Bull/Bear Zone at 1339.25-1341.25 (overnight low = 1340.75), and tested the 1349-1351 Resistance Zone. Responsive Sellers were active there on first test and pushed ES to 1343, where Buyers entered and the next swing up took ES through the 1349-1351 Zone (stop-run there) -- prices above 1350.25 were quickly rejected. Heading into the day session, we have Resistance at 1349-1351 (2011 RTH High = 1350.25), followed by 1356-1356.50 (2011 Globex High = 1356.50). These are stronger areas of resistance, and it could take a few attempts to get through them -- this could result in some choppy price action, and calls for extra caution up here. On the downside, we have Initial Support at 1344.50-1346.50, and the Micro Bull/Bear Zone at 1339.25-1341.25, followed by the 1335-1336.25 Support Zone. Use the Opening Range and Opening Type to determine immediate bias off the open. ES is set to open above Value, which could attract Responsive Sellers.

5-min Chart with EMiniPlayer.net Support/Resistance Zones

View full size chart

Wednesday, February 8, 2012

E-Mini S&P 500 Futures Trade Plan & Chart for Wed. 02/08

Today's EMiniPlayer.net Trade Plan
Overnight, ES bounced off the previous day's VPOC at 1342.50 and the Buying shut off 3 ticks ahead of the 1349 Resistance. Heading into the day session, we have Initial Support at 1341.75-1343.75, and the Micro Bull/Bear Zone at 1338.50-1340.50. For upside continuation, ideally, Buyers should hold ES above Initial Support. A break below Initial Support would provide an early sign of weakness, and we'll use the 1338.50-1340.50 Micro Bull/Bear Zone to establish directional bias. On the upside, we have Initial Resistance at 1349-1351 (2011 RTH High = 1350.25), followed by 1356 (2011 Globex High = 1356.50) -- expecting Responsive Sellers to be active at Resistance there (profit-taking). A break and hold above Resistance could trigger stops and result in a short covering move, resulting in a quick push higher. Bigger picture, Buyers remain in Control, but we're hitting up against some major Resistance now, and markets don't usually blast through these areas on first attempt. Today's quiet U.S. econ calendar leaves the focus on Greece debt-talks. ES is set to open above Value.

5-min Chart with EMiniPlayer.net Support/Resistance Zones

View full size chart

Tuesday, February 7, 2012

E-Mini S&P 500 Futures Trade Plan & Chart for Tuesday 02/07

Today's EMiniPlayer.net Trade Plan
Overnight, the failure at 1337.25-1339.25 resulted in a test of the 1333.25 level, where Responsive Buyers were active and shut off the Selling. Heading into the day, we'll be using 1337.25-1339.25 as the Micro Bull/Bear Zone to establish short-term directional bias. On a break & hold above 1339.25, I expect a test of 1341-1343, with 1349-1351 capping the upside. 1341-1343 is an important Resistance Zone, and failure/rejection here, followed by a break and hold below 1339.25 could result in a short-term reversal to the downside. Below 1337.25-1339.25, we have Pre-Market Support at 1333.25, Initial Support at 1328.50-1330.50, 1326.50 Support, and finally the 1322.50-1324.50 Support Zone, where I expect Selling to shut off. The primary economic catalyst today is Consumer Credit at 2:00 PM (CT). Bigger picture, Buyers remain in Control above 1320 but short-term directional bias will be based on how price reacts at 1337.25-1339.25 -- short-term, Sellers hold Control below that price zone. We could get continued Balance, with a wider Value Area where Responsive Sellers are active above yesterday's range and Responsive Buyers are active below it.

5-min Chart with EMiniPlayer.net Support/Resistance Zones

View full size chart

Monday, February 6, 2012

E-Mini S&P 500 Futures Trade Plan & Chart for Monday 02/06

Today's EMiniPlayer.net Trade Plan
Overnight, ES held above the 1329-1331 Support while 1337.50 Resistance capped the upside, and we ended up with a Balanced overnight session. Heading into the day, we have Initial Support at 1329-1331; rejection at that Support Zone would bring the 1336-1337.50 Pre-Market Resistance into play, followed by 1339.25-1341.25 Initial Resistance (previous Close at 1339, previous VPOC at 1339.25). With no key economic releases scheduled for today, any news out of Europe will be the focus and drive price. Bigger picture, Buyers are in Control and in the event that we break below 1329-1331, the expectation is for Responsive Buyers to be active at every support area (1326.50, 1322.50-1324.50, 1320). On the upside, the primary target is 1339.25-1341.25. Overall, the expectation is for a Balanced session with Responsive Buyers active at Support as ES consolidates Friday's breakout. Short-term bias remains Bullish above 1329-1331. Bigger picture bias remains Bullish above 1320.

5-min Chart with EMiniPlayer.net Support/Resistance Zones

View full size chart

Friday, February 3, 2012

E-Mini S&P 500 Futures Trade Plan & Chart for Friday 02/03

Today's EMiniPlayer.net Trade Plan
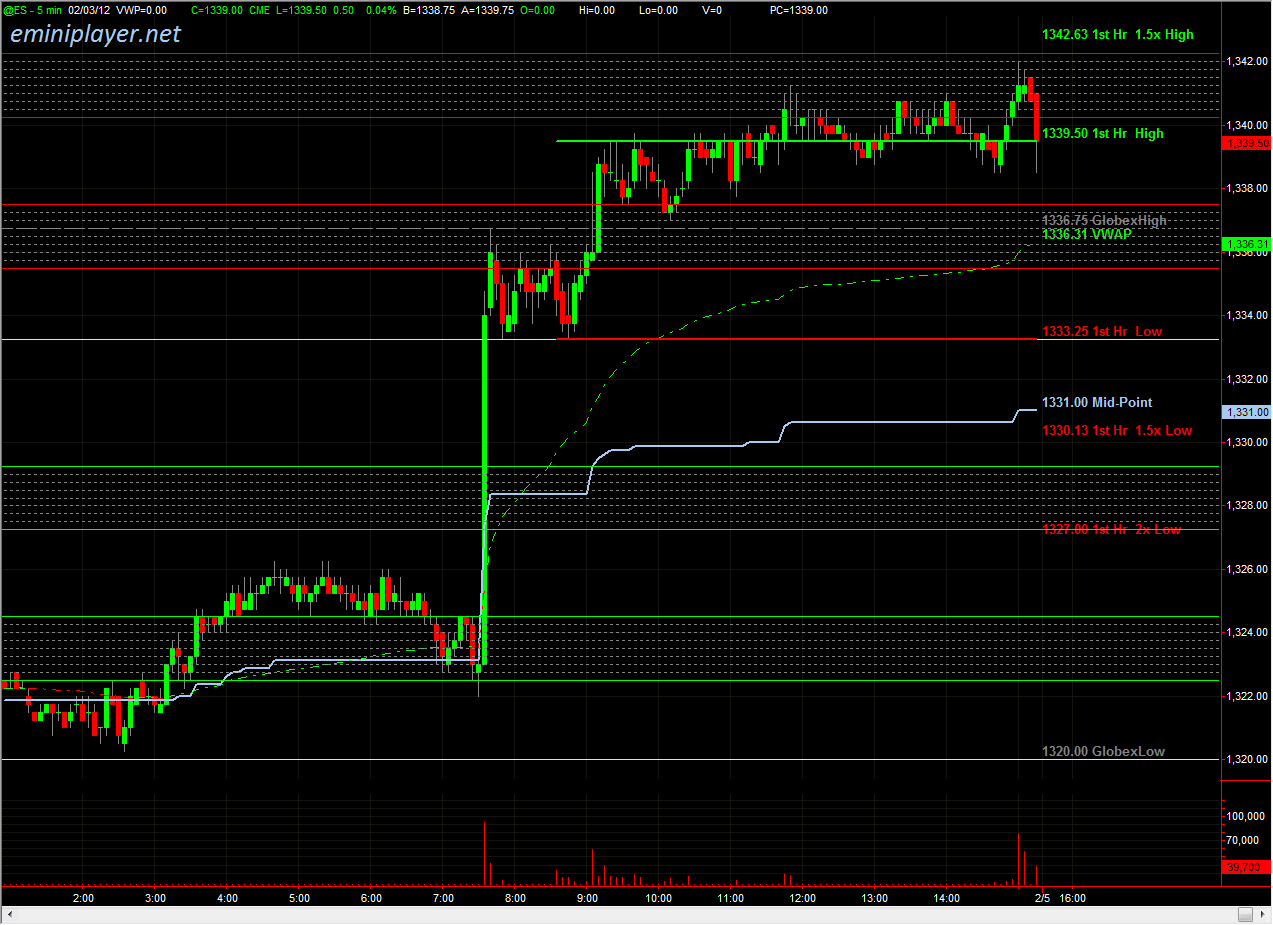
ES held the 1320 Support in the overnight session, and broke out to the upside on the positive NFP/Employment report, testing the 1335.50-1337.50 Resistance Zone, where Responsive Sellers were active on 1st test. Above there, we have Resistance at 1340.25-1342.25 (Open Gap 1340.25) -- Sellers may the cap the upside there. On the downside, we have Initial Support at 1327.25-1329.25, followed by 1322.50-1324.50 and the Bull/Bear Line in Sand at 1320. NFP day sessions usually result in two-side price action, so even though Buyers are in Control, I'm expecting opportunities on both sides (Long and Short). We'll be using 1333.25 as the Micro Bull/Bear Line in Sand off the open to establish short-term directional bias. Overall, Buyers remain in Control and ES is set to open above Value.

5-min Chart with EMiniPlayer.net Support/Resistance Zones

View full size chart

Thursday, February 2, 2012

E-Mini S&P 500 Futures Trade Plan & Chart for Thursday 02/02

Today's EMiniPlayer.net Trade Plan
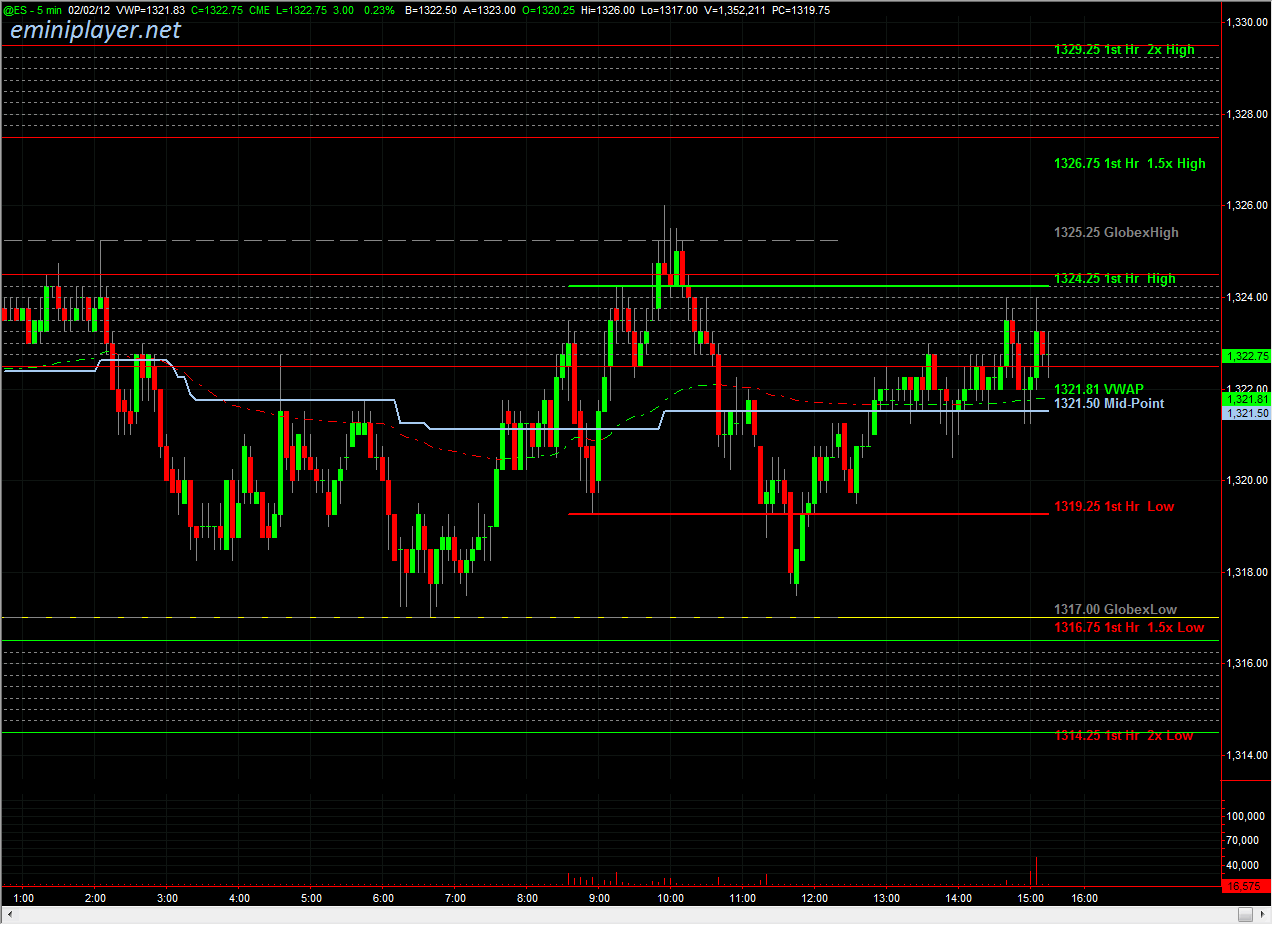
Overnight, ES balanced in the upper part of yesterday's range, with Buyers remaining in Control. Heading into the day session, we'll be using 1317 as the Micro Bull/Bear Line in Sand to esablish short-term directional bias. We have Initial Support at 1314.50-1316.50, followed by 1308-1310 (NVPOC 1308, Open Gap 1308.25). On the upside, we have Pre-Market Resistance at 1322.50-1324.50 (previous VPOC 1322.50), followed by Initial Resistance at 1327.50-1329.50. The expectation is for Responsive Buyers to be active at Support, and Responsive Sellers to be active at Resistance, with an upward bias above 1317. Bigger picture, Buyers remain in Control and 1308-1310 is Key Support. The expectation is for a relatively Balanced session ahead of tomorrow's NFP/Employment report.

5-min Chart with EMiniPlayer.net Support/Resistance Zones

View full size chart

Friday, February 11, 2011

E-Mini S&P 500 Futures Trade Plan for Friday 2/11/11

Notes for Overnight Session (posted Thursday evening)
Today's "P"-Shaped Profile is indicative of Short Covering, but we have to keep the Bullish Context in mind and realize that this is Short Covering within an up-trend. We're working within the 1308.50-1322.25 Balance Area, with the Balance Area VPOC at 1316. We have Resistance at 1316.50-1318.50. A break and hold above 1316.50-1318.50 would confirm Buyers in Control, and could lead to new highs. A break below 1310 could lead to the gap fill at 1307.25, followed by a test of the 1303.75-1305.75 Area. Bigger picture, bias remains bullish above 1303.25.

Trade Plan for Friday 2/11
We're working within the 1308.50-1322.25 Balance Area, with the Balance Area VPOC at 1316. ES balanced below 1316 in the overnight session and built Acceptance at 1314.75. The 1316.50-1318.50 Resistance identified in last night's Review/Analysis post has capped the upside in pre-market. Heading into the day session, the primary catalyst is the Consumer Sentiment # out at 8:55 AM (CT) -- and considering the market is in Balance, the expected opening type is an Open Auction In Range. Keep an eye on the 1314-1316 Area to determine Control. Holding above 1314-1316 would indicate Buyers in Control, and a break & hold below would indicate Sellers in Control. We have an open gap from yesterday's Close at 1318.75, but holding above 1316 opens the door for new highs so I won't be too aggressive on the Short side up there. The next resistance level above 1322.25 is at 1326, followed by strong resistance at 1329.25-1331.25, and I expect any Buying to shut off there. On the downside, a break below 1310 could take us to the 1307.25 gap fill, followed by a test of the 1304-1306 Support Area. The Bull/Bear Line in Sand is at 1303.25, and bigger picture bias remains Bullish above that level.

Econ Data
Jobless Claims at 7:30 AM (CT), Wholesale Trade at 9:00 AM (CT), EIA Natural Gas Report at 9:30 AM (CT), 30-Yr Bond Auction at 12:00 PM (CT), Treasury Budget at 1:00 PM (CT), Fed Balance Sheet and Money Supply at 3:30 PM (CT).

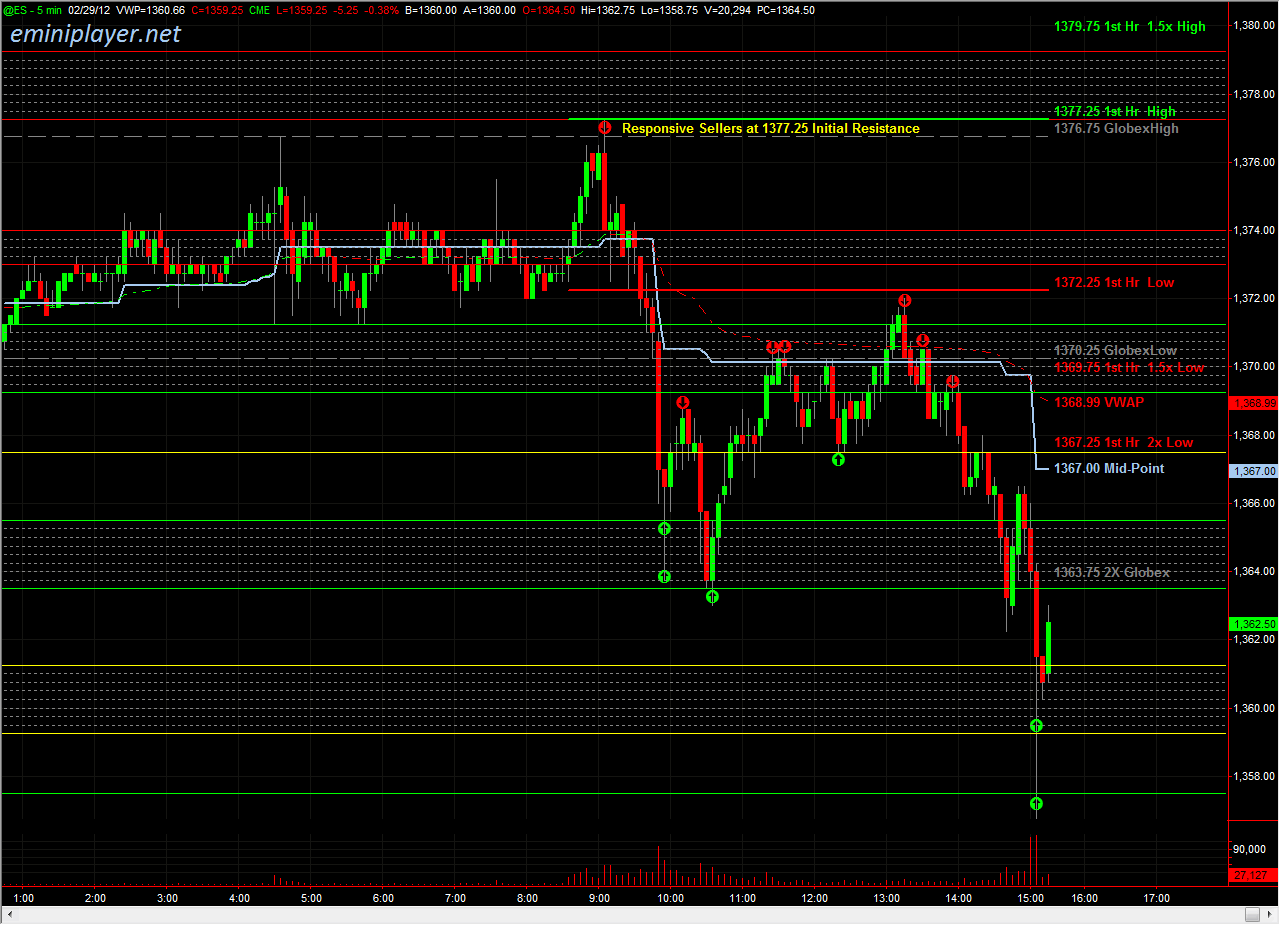
ES 5-min Chart with the EMiniPlayer S/R Zones
Thursday, February 10, 2011

E-Mini S&P 500 Futures Trade Plan for Thursday 2/10/11

Notes for Overnight Session (posted Wednesday evening)
The existing S/R Zones are in-play and we're still working within the 1310-1322.25 developing Balance Area, with the Balance Area VPOC at 1318.25. I'm looking for an expansion of the 1310-1322.25 Balance Area. The next primary catalyst is the Jobless Claims # at 7:30 AM (CT).

Trade Plan for Thursday 2/10
ES tested the bottom of the developing Balance Area at 1310 in the overnight session, and built Acceptance at 1312. Above here, we have Resistance at 1315-1316.50, followed by the Balance Area VPOC at 1318.25 and yesterday's Close (open gap) at 1319.25. Each of these levels can bring in Responsive Sellers, and I expect some rotation at these areas. A break through the 1318.25-1319.25 Area could lead to new highs, so be cautious on the Short side above that area. If we break below 1310, this will be the first test below the developing Balance Area, and I expect Responsive Buyers to be active at the Support Zones. We have an open gap at 1307.25, followed by Initial Support at 1304-1306, and I anticipate Responsive Buyers there. The Bull/Bear Line in Sand is at 1303.25, and the overall bias remains bullish above that level.

Econ Data
Jobless Claims at 7:30 AM (CT), Wholesale Trade at 9:00 AM (CT), EIA Natural Gas Report at 9:30 AM (CT), 30-Yr Bond Auction at 12:00 PM (CT), Treasury Budget at 1:00 PM (CT), Fed Balance Sheet and Money Supply at 3:30 PM (CT).


ES 5-min Chart with the EMiniPlayer S/R Zones