Showing posts with label After Holiday. Show all posts

Tuesday, February 16, 2010

Tuesday 02/16/2010 - Crude Oil Futures Review/Analysis

Light Sweet Crude Oil Futures
Solid up-trend in Crude, with clear action around Support/Resistance areas. By that, I mean when Crude broke through an Area of Resistance, it then acted as Support on a re-test.

CL 5-Minute Chart for 02/16/10

Tuesday 02/16/2010 - E-Mini S&P 500 Futures Review/Analysis

E-Mini S&P 500 Futures Review/Analysis
The Key Levels and Scenario posted last night played out well, and although I was too busy to put on any trades, my view of the market was clear and I wasn't looking for Shorting opportunities into the up-trend. I mention this because a year ago, this was not the case and I would have been fighting the trend all day. But today's price action, although boring for better part of the day, seemed very clear to me. The NYSE TICK spent majority of the day above the zero line, with modest moves down to the -600 area. Looking at the 30-minute Day Session Profile, we can see that price remained above the IB High from 10:30 AM (cst) on.

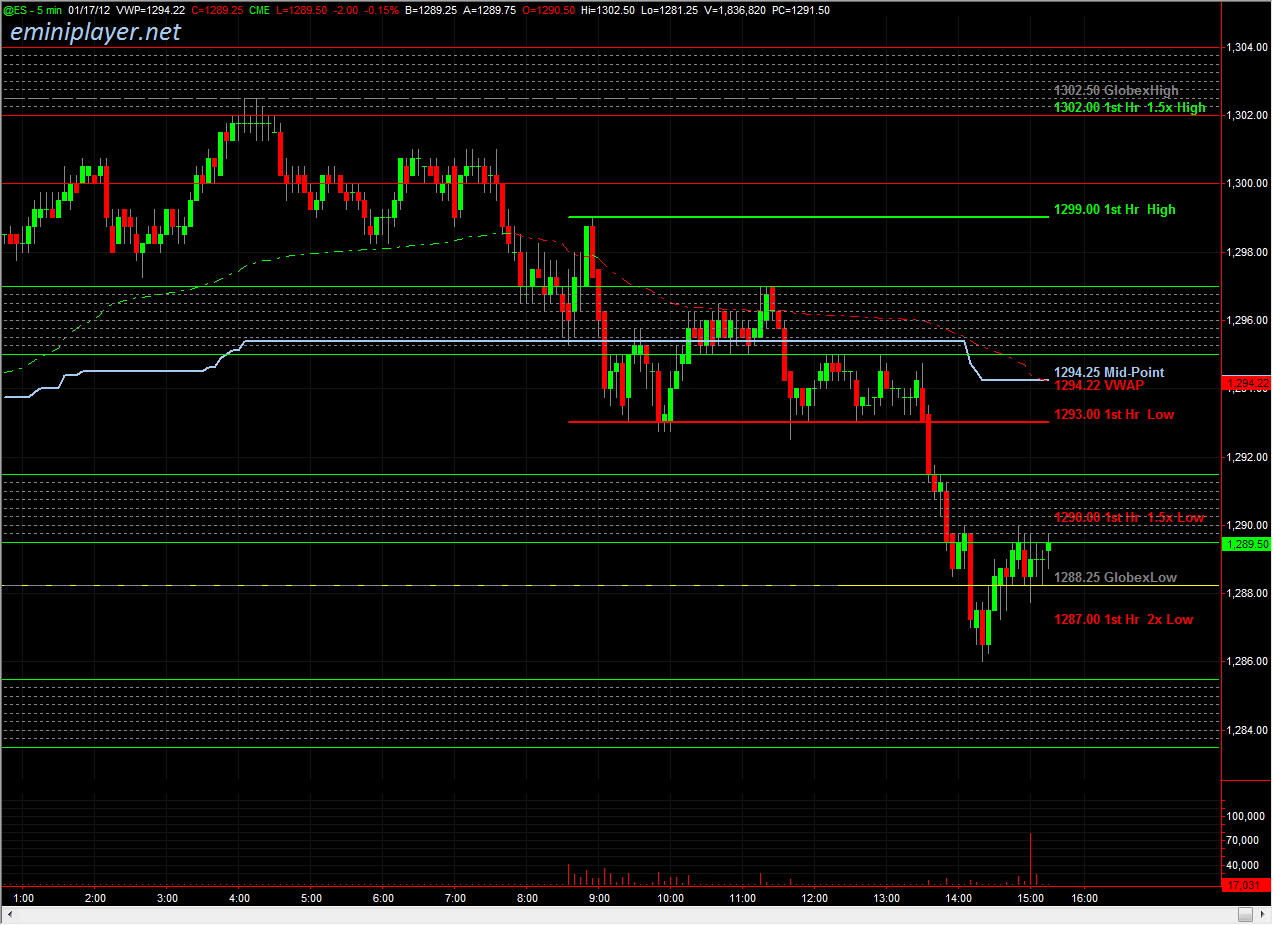
ES 5-Minute Chart for 02/16/10


ES 30-Min Volume Profile Chart for 02/16/10


ES Day Session Volume Profile Chart for 02/16/10

Monday, February 15, 2010

Tuesday 02/16/2010 - Crude Oil Futures Key Support/Resistance Levels

Light Sweet Crude Oil Futures
Just started looking at Light Sweet Crude Oil Futures on NYMEX and tracking some Key Levels for my education. Accuracy will improve over time as I learn and adapt the Key Levels for that specific market.

CL - Daily Chart with Volume Profile and Key Levels

Tuesday 02/16/2010 - S&P 500 Futures Key Support/Resistance Levels

E-Mini S&P 500 Futures
Based on last week's Buying activity, I'm anticipating upward continuation. We're heading into heavy Areas of Resistance, but also have strong Support below (1064-1067). Unless we get some news-driven activity (Greece, etc), I'm anticipating rotational moves regardless of overall direction. Tuesday is also light on the economic data front, with market-moving econ data coming out later in the week.

Econ Data
Empire State Mfg Survey at 7:30 AM (cst), Treasury International Capital at 8:00 AM (cst), Housing Market Index at 12 PM (cst).

ES - Daily Chart with Volume Profile and Key Levels

Tuesday, January 19, 2010

Tuesday 01/19/2010 - E-Mini S&P 500 Futures Review/Analysis

E-Mini S&P 500 Futures Review/Analysis
I know I'm not the only one who was surprised by the unusually strong up move today. I was not anticipating such a strong up move, but was open to the idea. I posted last night that my "process goal will be to keep the personal bias in check, and keep my mind open to bullish scenarios as well." That thought alone kept me out of trouble today. One way I gauge momentum and strength of bulls/bears is by measuring the range of the up/down rotations. As you can see from the 5-min chart, the rotations in the overnight session were favoring the bears with upward rotations averaging around 1.25 points and downward rotations averaging 2.25 points. This relationship reversed when ES pushed from 1127.50 (7:20 AM cst) to 1132.75 (7:40 AM cst). Price also remained above the mid-point and VWAP right from the cash open; another sign that Bulls were in control.

ES 5-Minute Chart for 01/19/10

Monday, January 18, 2010

Key Support/Resistance Levels (S&P 500 Futures) for Tuesday 01/19/2010

E-Mini S&P 500 Futures
My bias is bearish below 1137.75, neutral between 1137.75 and 1142 and cautiously bullish above 1142. So far, the price action is turning out to be very similar to MLK day 2006. If that's any indication, we could see much lower prices over night and into the morning session. I'll be looking towards the Globex Low to provide some support at the cash open, and will then key off the over-night mid-point as near-term resistance. Although my current bias is bearish, I have to recognize the fact that 1129.50 was rejected over the short holiday session, and ES has continued to build value above 1134. Tomorrow's process goal will be to keep the personal bias in check, and keep my mind open to bullish scenarios as well.

Econ Data
Treasury International Capital at 8:00 AM (cst), State Street Investor Confidence Index at 9:00 AM (cst), and Housing Market Index at 12:00 PM (cst).

ES - Daily Bar Chart with Volume Profile and Key Levels

Monday, December 28, 2009

Monday 12/28/2009 - E-Mini S&P 500 Futures Review

E-Mini S&P 500 Futures Review/Analysis
The scenario from last night anticipated range-bound trade within the Globex High and Low, and that played out well in the market today. Globex High was 1125.50, and the high of day was put in place early in the morning at 1126.25 (3 ticks above Globex!). Price couldn't even reach Globex Low, and instead found buyers at the previous day's mid-point at 1119.50. Price retraced and closed at 1123 (within the Initial Balance and Value Area, above the Mid-Point, and a tick above the VWAP).

Near-term bias is stil bullish, but tomorrow's Econ data could upset that. Anticipating range extension tomorrow.

ES 5-Minute Chart for 12/28/09 Includes Overnight Globex
ES 5-Minute Chart for 12/28/09

Sunday, December 27, 2009

Key Levels & Scenarios (S&P 500 Futures) for Monday 12/28/2009

E-Mini S&P 500 Futures
Psychologically, the toughest trade tomorrow morning is going to be Buying, which is exactly why continued UP movement wouldn't surprise me. I believe the market is at an inflection point; we either solidify and build a base in the 1109-1122 area and move up towards the 1180 level - OR - we run the stops, and then fail hard! I'm not anticipating this big picture scenario to play out this week, but it's something to be aware of.

Scenario
For tomorrow, I'm anticipating a range-bound day. Use the Globex High/Low to get an estimate of the day's range. Unless price is moving on high momentum and volume, I would look to fade the Globex High and Low on first touch. Price has already hit my initial upside range extension level and retraced 1.50 points in the overnight session.

ES - Daily Bar Chart with Volume Profile and Key Levels

Sunday, November 29, 2009

Key Levels and Scenarios (S&P 500) for Monday 11/30/2009

E-Mini S&P 500
Despite the big moves on Thursday/Friday last week, the key levels haven't really changed much. 1198 is immediate resistance, with the overhead initial resistance level at 1101.75. Initial support is 1089.25. ES is currently building value under 1097. Last year, the Monday following Black Friday was a straight down trend from the globex overnight session into the day session close. My current bias is to the short side, but I'm not anticipating range extension on the down side. Higher probability of range extension to the upside, since we're already in the upper quadrant of Friday's range.

Bullish Scenario
The initial support zone is 1086.75-1089.25, and I'd like to see that area hold before I consider trades on the Long side. 1082.50 is also still a pretty important area. Ideally, price breaks above 1097, hits the 1101-1102 area, rotates down, and holds 1097-1098 on the retrace. At that point, entering Long with a stop at/below 1098 would be a high-probability trade, IMO. Scale out at 1102, or move stop to break-even and let it test the next area at 1105-1107.50. Scaling out or reversing position to the short side at 1107.50-1108.50 area is looking good as well. Above 1108, the obvious resistance is 1112.25, and then I'll look towards the range extension targets to provide areas to scale out or enter short.

Bearish Scenario
I think the bearish scenario is in-play at the moment. 1197-1198 is holding as resistance. Above that, if 1102 holds as resistance, and we come back down and break below 1098, shorting pops would be the name of the game for me. Who knows, we may not even get to 1102. I would scale out of shorts at the support zones/levels identified on the Key Levels chart.

ES - Daily Bar Chart with Volume Profile and Key Levels

Thursday, November 26, 2009

Key Levels (S&P 500) for Friday 11/27/2009

E-Mini S&P 500
In case you guys were busy with the Thanksgiving festivities and missed the news, Dubai requested a debt 'standstill' till May; essentially saying they can't make payments on their debt until May, 2010 (full story on Yahoo Finance). It's a small loan - roughly $60 billion! That, in turn, shook up the world markets and the S&P futures took a nose dive down to 1082.75 (1082.50 is a Key level). So, now the question is: will 1082.50 hold? The Dubai issue has been on the radar for a while now, so I don't know whether it's really a sufficient catalyst for a big sell off, and not to mention, $60Billion is not really a catastrophe. But anything can happen so best to stick to the charts and levels.

Bullish Scenario (if 1082.50 Holds)
If 1082.50 holds, I'm thinking a move back up to 1097 is do-able, but I'm not anticipating it to be in one quick shot; although even that scenario is certainly possible if shorts decide to cover all at once at the open (unlikely). I'm anticipating price to make a rotational move up, making pit stops at the resistance levels along the way (refer to chart for levels). Initial area of resistance is 1087.50-1088.50, above that we have 1093.75-1097 (kinda wide, but that's how I'm reading it right now). 1100-1101.50 above that. Longs are counter-trend for now, so buy the dips, sell the rips!

Bearish Scenario (if 1082.50 breaks)
Below this area, we have initial support at 1078.50, and stronger support at 1076. Anticipating that area to hold on first touch; good area to scale out of short and reload on rotation. 1072-1075 are the range extension targets, and would be the second area to scale out of shorts, or even initiate a Long position. 1069.50 after that, and 1064 is the Final target if we get a big sell off.

Good luck tomorrow!

ES - Daily Bar Chart with Volume Profile and Key Levels

Thursday, November 12, 2009

Thursday - 11/12/2009 Setups

The same setups show up day after day on the 5-minute chart...

ES - 5-minute Chart


Lets walk through the day step by step and rationalize it a bit using basic concepts and S/R levels:
  • Yesterday's Low was 1091.25 (support). Price bounced off 1091.75 on the open.
  • Yesterday's High was 1103.25 (resistance). Price hit a high of 1101.00 this morning and sold off from there.
  • ES moved down from 1101.00 through the mid-point and VWAP and bounced at 1094.25 (sign that bears may be in control now)
  • Price retraced back up and chopped around the mid-point and VWAP for a bit (bulls losing the battle), and then popped up to 1099 (1098.50 was .618 retracement of the 1101-1094.25 swing).
  • Sold off again from there, and broke down through the mid-point and VWAP (bears in control), and found some support at 1090 (1088-1090 was a support level posted on earlier Key Level charts).
  • At this point, the first hour low has been established at 1091.75 and will act as an area of resistance.
  • ES sells off again, and finds some support at 1088.50 (1088 posted as Key Level on earlier charts).
  • Price attempts to retrace back up a couple of times, but doesn't manage to cross 1091.75 on a closing basis, and we see more selling pressure.
  • We get another bounce at 1087, and price retraces back to 1091 (1090.50 is .618 retracement of the 1092.50-1087.00 price swing).
  • The next area of support on the Key Levels chart was 1084.25, and we got a bounce at 1084.50.
  • Prior support becomes resistance, so we can now use the 1088s and the 1087s as resistance. Price retraced back to 1087, and sold off again; this time moving down to 1082.50.
  • Finally, ES retraced from 1082.50 back up to 1087.50, which is where it closed (1086.50 = Value Area Low).

I hope the commentary was helpful and gave you some ideas on the levels/areas to watch during the day.

Tuesday, May 26, 2009

Tuesday 05/26/09 - Parabolic Moves Suck

I don't like trading days like today where there's a quick parabolic move followed by a slow grind. I've seen these types of days before so I traded it as I knew best, which was by identifying the consolidation ranges and buying towards the bottom of the range. I'm glad I didn't attempt to Short the move, although I have to say the temptation was most certainly there. The disappointing part is, I had a Buy signal at 885 prior to the Consumer Confidence news, but didn't take it because I saw (perceived) weakness in the Energy sector (XLE). Perhaps I'm putting too much weight in the Energy and Financial sectors, and should just use them as a general barometer, rather than a criteria for trade entry. Any thoughts on this would be appreciated.

I only took three trades today so I'll go over them (Chart attached below)

Trade #1
Entered Long on small pullback at 900 around 9:30 AM (central). Moved stop-loss to break-even when position went 6 ticks in favor. I was stopped out at break-even a few minutes later, and price moved 4+ points in my favor immediately after I was stopped out (doh!)

Trade #2:
Entered Long at 904.75 around 10:50 AM. I definitely entered a bit early on this one; should have entered at 903.75, but it is what it is. I was using a 2-pt stop-loss, and price hit a low of 902.75 at 11:10 AM, and I was promptly stopped out for -2 pts. That was the Low point of the swing, and price didn't touch 902.75 for the remainder of the session (luck was def. not on my side today).

Trade #3:
Entered Long at 903.00 around 11:15 AM with a 6-tick stop-loss. Let this one run for +4 pts, and exited at 907.00 around 11:50 AM. I was expecting price to head higher, but didn't want to be greedy (Friday's Stop-Loss experiment showed that it's good to take profit once price has moved 4-5 pts in favor). I called it a day at this point since price was just chopping around.

ES (5-Min) - Trade Chart


Stats:

# of Trades 3
Longs 3
Shorts 0
% Break-Even: 33.33
% Win 33.33
% Loss 33.33
Avg Win 4.00
Avg Loss -2.00
Largest Win (pts) 4.00
Largest Loss (pts) -2.00
Total Win (pts) 4.00
Total Loss (pts) -2.00
Net Gain/Loss (pts) 2.00
ES Daily Range 32.75
P/L as % of Daily Range 6.11

Lot of Econ News out this week so there should be plenty of volatility in the markets. Expecting support at 893 and resistance at 916 and 923. Existing Home Sales data out at 9:00 AM tomorrow. Btw, I won't be trading tomorrow since I have to head to Downtown to take care of all the paperwork for the new job.

ES (Daily) - Today's bullish candle on the Daily took out the bearish movement of the previous 3-4 sessions.