Showing posts with label support. Show all posts

Thursday, November 19, 2009

Key Levels (S&P 500) for Friday 11/20/2009

E-Mini S&P 500
The bearish scenario put together yesterday worked out great this morning. I was anticipating the move below 1100 to be fast - and price dropped 13 points from 1100.75 to 1087.75 in the first half hour of market open (1088 level marked as strong support for a few days now). The 1088 support level held (a 1.50 pt poke below 1088 doesn't really invalidate that "area" IMO), and I'm still counting on that area to hold as support. Could price break below it and test 1082.50? Sure. But I would anticipate a bounce around 1087 on first touch tomorrow (if we get there). Buyers were very active between 1090 and 1091.50 today. The VPOC for today was around 1092.75, and price is currently building/accepting value above 1091. Lets also keep the big picture in mind (daily chart). From that perspective, today's down move is no big deal, and I would anticipate the bulls to actively defend the Key areas of support (1088, 1082.50, 1076).

ES - Hourly Chart (Downside break-out from Triangle)


Bullish Scenario
On the upside, we now have resistance in the 1197 area (anticipating that to hold on first touch), then minor resistanct at 1100, followed by stronger resistance around 1102.50. We also have an open gap at 1108.50 now, and I would anticipate a gap fill on a move above 1102.50.

Bearish Scenario
On the bearish side, I'm anticipating 1087 area to hold on first touch. Below that, we could test 1082.50. It's interesting that price closed at 1082.25 on last month's options expiration Friday. Anticipating 1082.50 to hold on first touch, at which point, shorting the bounce would be a safe play for re-test/potential break of 1082.50. Below 1082.50, we could get a quick move to 1079; and then a grind down to 1076.50 area. Anticipating 1076 area to hold as support on first touch (scale out of shorts, or reverse to Long for a scalp, or possibly more here). If the selloff is really nasty, we could even get to the ultimate downside target of 1064 (not anticipating a strong selloff).

ES - Daily Bar Chart with Fib Levels (Perspective!)


ES - Daily Bar Chart with Volume Profile and Key Levels


Crude
Don't have time to do the levels for Crude tonight.
Thursday, November 12, 2009

Key Levels for Friday 11/13/2009

It's Friday the 13th, so be careful out there :-)

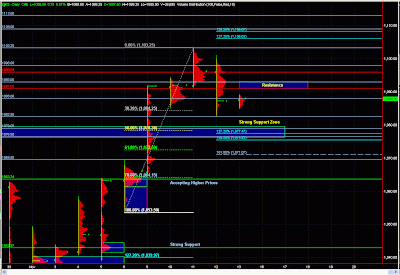
ES - Daily Bar Chart with Volume Profile and Key Levels

ES in a Bullish Price Channel on the Daily.

Wonder if it will test the lower end of the channel.

Wednesday, November 11, 2009

Wed. 11/11/09 - Levels

Last year on Veteran's Day, the market continued in direction of trend in the over night Globex session, as well as in the morning session, but then reversed hard in the afternoon session. I'm curious to see whether tomorrow turns out to be a similar pattern. Regardless, trade what you see!

ES - Daily Volume Profile with Levels

Tuesday, November 10, 2009

Tuesday 11/10/09 - Levels

Following charts show the levels I'm watching on ES and CL (Crude Oil)

ES - Daily Volume Profile


CL (Crude) Hourly Chart in a Bearish Channel


CL Daily Volume Profile

Sunday, January 25, 2009

Last Week of January

With all the economic releases and earnings reports coming out this week, it should provide plenty of volatility for short-term traders. I'll be trading very lightly this week, if I put on any trades at all; not due to the economic #s and earnings but because I have a technology project I really need to finish up, so I'll be dedicating the evenings working on the project. It's a win/win since it may actually keep me out of trouble during this volatile week, and it provides even more trading capital :-)

In other news, My Trading Rules were mentioned on The Kirk Report, which was very cool and as a result I now have a few more people following along on this Blog. Glad to have you guys here.

Some numbers to keep in mind:
865.75 - Previous week high
831.50 - Previous week mid-point
823.50 - Previous week close
797.50 - Previous week low
Based on Historical Volume Trends (where majority of the trades occurred), the 817 - 822 area is important, and then the 848 area.

Here are some Fib levels I'll be keeping an eye on this week (60-min chart)
817.75 - 50% retrace
807.25 - 78.6% retrace
849.94 - 38.2% extension


If you have any questions, or have your own S/R numbers you'd like to share, please do so by utilizing the comments section.

Saturday, January 17, 2009

S/R Numbers For Upcoming Week

From Hourly Chart
  • 942.75 - 200-bar High
  • 857.75 - 50-bar High
  • 842.00 - 50% Fib Retracement
  • 826.50 - 5, 10, 20-bar Low
  • 812.75 - 50 & 200-bar Low
From 4-Hour Chart
  • 942.75 - 50 & 200-bar High
  • 893.00 - 61.8% Fib Retracement
  • 877.75 - 50% Fib Retracement
  • 875.00 - 20-bar High
  • 857.75 - 5 & 10 -bar High
  • 826.25 - 5-bar Low
  • 812.75 - 10, 20, 50-bar Low
  • 812.50 - 200-bar Low
From Daily Chart
  • 1008.00 - 50-Day High
  • 942.75 - 20-Day High
  • 885.50 - 5-Day High
  • 877.75 - 50% Fib Retracement
  • 812.75 - 5 & 20-Day Low
  • 747.75 - -50% Fib
  • 738.50 - 50 & 200-Day Low
From Weekly Chart
  • 812.75 - Previous Week's Low
  • 885.50 - Previous Week's High
  • 848.50 - Previous Week's Close
From Monthly Chart
  • 812.50 - December Low
  • 897.00 - December Open
  • 900.00 - December Close
  • 918.75 - December High
  • 942.75 - January High
  • 965.25 - November Open
  • 1008.00 - November High
  • 976.25 - January, 03' Close, February 03' Open
  • 985.50 - February 03' High