Showing posts with label November. Show all posts

Wednesday, November 23, 2011

E-Mini S&P 500 Futures Trade Plan & Chart for Wed. 11/23

Trade Plan from EMiniPlayer.net
The fast liquidation move below 1180.50 mentioned in yesterday's Trade Plan materialized in the overnight session, with the Selling shutting off 3 ticks ahead of the 1166 Support. Heading into the day session, we have Pre-Market Support at 1170-1172, followed by Initial Support at 1165.50-1167. Below 1165.50, 1157-1158 is a KEY area (NVPOC at 1158), and we could get an aggressive Buy Response there. Use the Opening Range to determine which side is in short-term control (Price above OR = Buyers in Control, Price below OR = Sellers in Control). Unless we get an Open Drive to the upside, the expectation is for a Balanced session, with Responsive Buyers active at Support and Responsive Sellers active at Resistance (b-Shaped profile with Selling tail). The 1184-1185.25 Resistance Zone could cap the upside, with 1189-1191 being an extreme (unlikely that we'll tag this today). The U.S. markets are closed tomorrow for Thanksgiving, so expect lighter volume today with choppy price action -- be selective on Trade Location and setups. ES is set to open below Value.

5-minute Chart with Support/Resistance Zones

View full size chart

Tuesday, November 22, 2011

E-Mini S&P 500 Futures Trade Plan & Chart for Tuesday 11/22

Trade Plan from EMiniPlayer.net
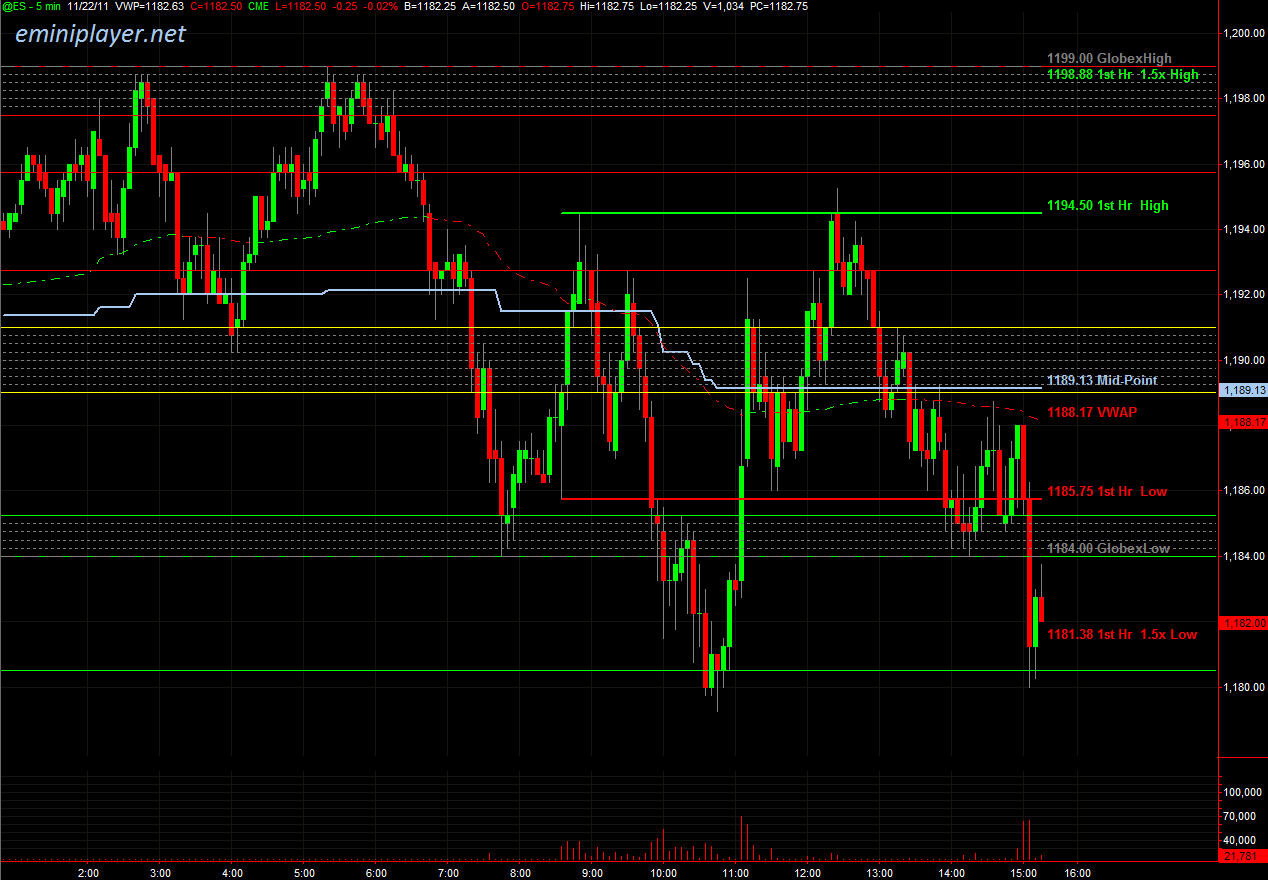
Sellers remained in Control and the 1199 Resistance Level capped the upside in the overnight session. Heading into the day session, we have Initial Support at 1184-1185.25. Holding above that area would bring the previous VPOC at 1190 and the gap fill at 1190.75 into play as targets. Unless we get an Open Drive to the downside, there's a high probability of testing the 1189.75-1190.75 area. Today's Bull/Bear Zone is at 1189-1191. On a break and hold above 1191, we have yesterday's Value Area High and the overnight VPOC at 1195.75. A break-out above 1195.75 would be indicative of Initiative Buying, and we'd have to be cautious on the Short side. On the downside, a break below yesterday's Low of 1180.50 could lead to a quick move down to 1174.50 and 1170-1172. Overall, the expectation is for Responsive Buyers to be more active on tests of Support now and the short-term bias is Bullish above 1184-1185.25.

5-minute Chart with Support/Resistance Zones

View full size chart

Monday, November 21, 2011

E-Mini S&P 500 Futures Trade Plan & Chart for Monday 11/21

Trade Plan from EMiniPlayer.net
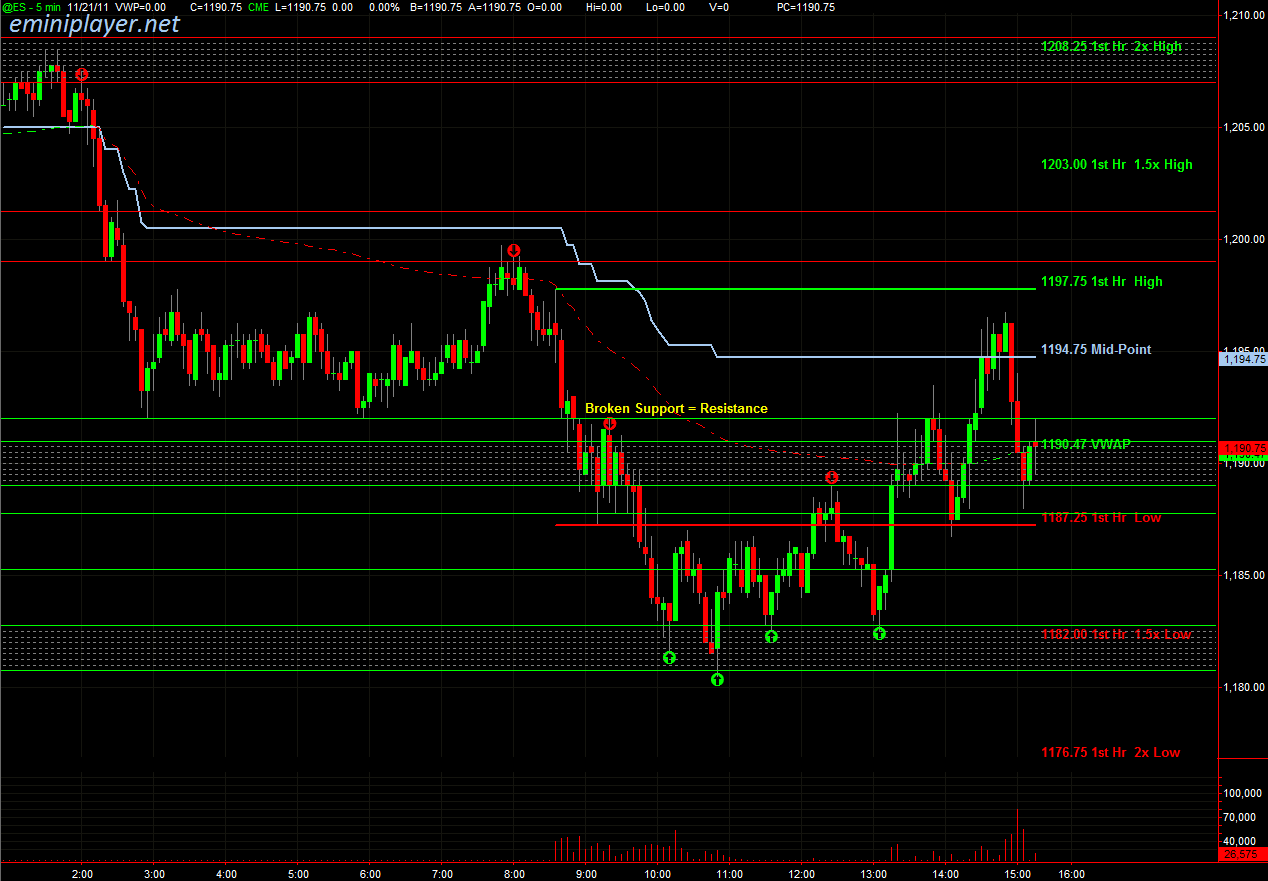
We had the Bull/Bear Area to establish bias at 1211-1213 and the Notes for O/N Session mentioned that "holding below it brings the 1199 and 1189.50-1191.50 Zones into play; the expectation is for Responsive Buyers to be active there on first test." ES failed at Friday's Low, and we got a test of 1199 and a double-bottom 2 ticks ahead of the 1191.50 Support. From there, Responsive Buyers pushed ES back to the 1199 area (broken support = resistance). Heading into the day session, we have Resistance at 1199 and 1201.25-1203.25, and Initial Support at 1189-1191. ES is set to open below Value, which could attract Responsive Buyers -- we want to see an Open Drive to the downside or an Open Auction Out of Range, with ES holding below the OR High and the Opening price before pressing on the Sell side. Holding above the Opening Range could result in a test of Initial Resistance at 1207-1209, and the Bull/Bear Zone at 1211-1213. Above that, we have the gap fill at 1213.50 and the previous VPOC at 1214. On the downside, the expectation is for Responsive Buyers to be active at 1189-1191. A swift break of that Support Area would indicate very weak Buyers.

5-minute Chart with Support/Resistance Zones

View full size chart

Friday, November 18, 2011

E-Mini S&P 500 Futures Trade Plan & Chart for Friday 11/18

Trade Plan from EMiniPlayer.net
ES held above the 1208.50 Support in the overnight session while the 1229-1231 Bull/Bear Zone capped the upside. Heading into the day session, the expectation is for Responsive Sellers to be more active off the open. Today's Bull/Bear Zone to establish bias is at 1229.25-1231.25; Sellers remain in Control below, while a break and hold above it would indicate Buyers re-gaining Control. The primary downside targets include the gap fill at 1215 and the previous VPOC at 1211. Yesterday's Value Area Low is at 1212.75, and unless we're getting strong Selling, it's safer to cover/scale-out of Shorts by 1213 since Responsive Buyers could be active in that area. We have Initial Resistance at 1224-1226; a break and hold above that area would indicate weak Sellers and ES could re-test the 1234 area. Overall, if we hold above 1209-1211, the expectation is for ES to balance within yesterday's range, while a break below 1209 could result in a test of 1203.25 and 1199-1201. Use the Opening Range and Opening Type to establish immediate bias. Unless we get an Open Drive to the upside, the focus will be on the Sell side off the open.

5-minute Chart with Support/Resistance Zones

View full size chart

Thursday, November 17, 2011

E-Mini S&P 500 Futures Trade Plan & Chart for Thursday 11/17

Trade Plan from EMiniPlayer.net
The 1239.25-1241.25 Resistance provided ideal trade location to Sell in the overnight session. Responsive Buyers shut off the Selling at the 1220.25 Support, and pushed ES back to yesterday's range. Heading into the day session, 1229-1231 is a KEY price area for Buyers. We'll be using the 1229-1231 area to establish short-term bias, and the 1244.50-1246.50 Bull/Bear Zone for overall bias. The primary catalyst this morning is the Philly Fed Survey at 9 AM (CT) -- we typically get range-bound two-way trade heading into this econ report, so be mindful of that during the first half hour. Above 1229-1231, we have Initial Resistance at 1239.25-1241.25, followed by 1244.50-1246.50 (Bull/Bear Zone) and the Resistance Zone at 1248.50-1250.50 (NVPOC at 1248.75). Below 1229, we have Initial Support at 1223-1225, followed by 1218.25-1220.25 and 1214-1215 (NVPOC at 1214). ES is set to open below Value.

5-minute Chart with Support/Resistance Zones

View full size chart

Wednesday, November 16, 2011

E-Mini S&P 500 Futures Trade Plan & Chart for Wed. 11/16

Trade Plan from EMiniPlayer.net
ES balanced in a wide range in the overnight session, with the Selling shutting off ahead of the 1237.75 open gap, while 1258.75 capped the upside. Heading into the day session, we have the Bull/Bear Line in Sand at 1248-1250 (Previous VPOC at 1249) and Initial Resistance at 1251.75-1253.75 (Open Gap at 1253.75). On the downside, we still have an Open Gap at 1237.75 and a NVPOC at 1237. The 1229-1231 Initial Support is KEY for Buyers, and a break and hold below it could eventually bring the NVPOCs at 1214 and 1207.50 into play. On the upside, holding above 1244 would open the door for testing the Bull/Bear Area as well as the Resistance Zones above. On the upside, the 1256.75-1258.75 Resistance Zone is KEY. A breakout above that area would eventually bring the NVPOCs at 1273.75 and 1278.25 and the Open Gaps at 1273.25 and 1281 into play. The next primary catalyst in pre-market is Industrial Production at 8:15 AM (CT), while the primary catalyst during the day session is the Housing Market Index at 9 AM (CT). The short-term bias heading into the day is bearish, but I expect Responsive Buyers at the Support Zones below with 1229-1231 being the one to hold. Use the Opening Range and Opening Type to establish immediate bias off the open. Sellers are in Control below 1244-1246 (Pre-Mkt Resistance).

5-minute Chart with Support/Resistance Zones

View full size chart

Tuesday, November 15, 2011

E-Mini S&P 500 Futures Trade Plan & Chart for Tuesday 11/15

Trade Plan from EMiniPlayer.net
We had the new Bull/Bear Area at 1247-1249, and the break and hold below it resulted in a move down to the NVPOC at 1237. Heading into the day session, we have Pre-Market Support at 1235.25-1237.25 (NVPOC 1237 and Open Gap 1237.75), followed by Initial Support at 1229.50-1231.50. The expectation is for Responsive Buyers to hold ES above Initial Support. A break below 1229 would indicate Sellers back in Control and ES could be setting up for eventually moving down to the NVPOC at 1214. On the upside, the primary target is the 1247-1249 Bull/Bear Area, followed by the Open Gap at 1252. A break and hold above 1252 would bring the 1256.25-1258.25 Initial Resistance Zone into play, as well as the 1261.50 NVPOC and the Open Gap at 1261.75. The primary catalyst this morning is Retail Sales at 7:30 AM (CT) and Business Inventories at 9 AM (CT). Use the Opening Range and Opening Type to determine immediate bias. If we open in the 1237 Area or below it, anything but an Open Drive to the downside would provide edge to Buyers.

5-minute Chart with Support/Resistance Zones

View full size chart

Monday, November 14, 2011

E-Mini S&P 500 Futures Trade Plan & Chart for Monday 11/14

Trade Plan from EMiniPlayer.net
The 1270.75 Resistance held to the tick in the overnight session and we got a pullback to the low 1250s, where Responsive Buyers were active on first test. Heading into the day session, we have the previous VPOC at 1261.50 and the previous close (gap fill) at 1261.75. A break above Initial Resistance would bring 1270.75 into play, with the open gap at 1273.25 and NVPOC at 1273.75 above that. The 1272.75-1274.75 will likely cap the upside. In the event of a downside move, we have Support at 1251-1253 followed by the Bull/Bear Area at 1248.25-1249.25. The selling could shut off by 1248.25. With no important econ releases, the expectation is for a Balanced session with Responsive Buyers active at Support and Responsive Sellers active at Resistance. Overall, Buyers remain in Control above the Bull/Bear Area with 1272.75-1274.75 as the final upside target on the day. Use the opening range, and opening type to determine immediate bias off the open.

5-minute Chart with Support/Resistance Zones

View full size chart

Tuesday, November 17, 2009

Key Levels (S&P 500 and Crude) for Wednesday 11/18/2009

E-Mini S&P 500
ES broke out above 1103.25 yesterday so consolidation at these levels was anticipated today (11/17) - No surprises! The 1,100 level gained some strength as support today, but I'm still skeptical on it until price moves above 1112.25. Seeing confluence of support in the 1096.50-1098.75 area now though, and expecting that area to hold on first touch (good place to scale out of shorts and/or enter a low risk Long trade if price gets there). Near-term support at 1105, then 1100. Seeing a confluence of resistance in the 1111.50-1112.50 area and anticipating price to pause there on first touch (good place to scale out of Longs and/or enter a low risk short). Beyond that, we have 1114.50 and then 1118. 1122 is the 50% retracement of the entire down move from 1590s, so a lot of people will be watching that level.

Consumer Price Index and Housing Starts data out at 7:30 am (cst) in the morning. Anticipating range expansion tomorrow.

ES - 5 Min Chart from Tuesday 11/17/09


ES - Daily Bar Chart with Volume Profile and Key Levels

Crude
CL - Daily Bar Chart with Volume Profile and Key Levels

Thursday, November 12, 2009

Key Levels for Friday 11/13/2009

It's Friday the 13th, so be careful out there :-)

ES - Daily Bar Chart with Volume Profile and Key Levels

ES in a Bullish Price Channel on the Daily.

Wonder if it will test the lower end of the channel.

Wednesday, November 11, 2009

Wed. 11/11/09 - Levels

Last year on Veteran's Day, the market continued in direction of trend in the over night Globex session, as well as in the morning session, but then reversed hard in the afternoon session. I'm curious to see whether tomorrow turns out to be a similar pattern. Regardless, trade what you see!

ES - Daily Volume Profile with Levels

Tuesday, November 10, 2009

Tuesday 11/10/09 - Levels

Following charts show the levels I'm watching on ES and CL (Crude Oil)

ES - Daily Volume Profile


CL (Crude) Hourly Chart in a Bearish Channel


CL Daily Volume Profile

Wednesday, November 26, 2008

Wednesday 11/26/2008 - Trades

I was off from work today, and was planning on taking the day off from trading as well and just make up on some lost sleep, which I did. I didn't trade the morning but watched the snail paced market action around 11 AM (chicago/central time). My sister dropped my 2-yr old nephew off at the house and I stepped away to go play with him. He usually likes to watch figher jet videos on YouTube but today he had to make do with watching the colorful charts jumping around. I brought him to the office and gave him a trading 101 lesson. The trades for today were taken during that time, with my nephew sitting on my lap monitoring the trades :D Not very serious trading but did keep it realistic with small size. Closed out the day with a net gain of $346.

Performance Summary/Stats


Trades Plotted on 1-Min Chart


Market Structure Chart (5-min)

Tuesday, November 25, 2008

Tuesday 11/25/2008 Trades

I didn't have time to trade on the train this morning, but with this being a short week, and several people out on vacation, it was pretty quiet at the office. Spent most of the morning just watching and learning, and didn't put on that many trades and kept size limited to 1-2 contracts. Also used tighter stops, mostly 6-8 ticks with quickly moving it to break-even once the trade went 4-6 ticks in my favor. This kept me out of trouble on some trades, but also wiggled me out of a couple of good ones. I need to improve my execution/entry so a tighter stop can work out. Ended the day positive with a net gain of $286.

Performance Summary/Stats


Trades Plotted on 3-Min Chart


Market Structure Chart (5-min)

Monday, November 24, 2008

Monday 11/24/2008 - Platform Setup

I'm not posting any trades from today since most of the day was spent/wasted messing around with getting Ninja Trader properly setup. Ran into some issues where NT couldn't keep up with the orders, and the size on the auto-stop/targets wasn't updating to reflect the position size as I would scale in/out. Due to that issue, NT would've actually reversed my position if the auto stop or target order was hit. I've emailed the support staff at Ninja Trader and they recommend I run TWS Build 887. I'm currently running the latest release; Build 889 and the oldest build offered on IB's website is Build 888. I don't think the probems I'm experiencing have anything to do with the TWS build, but it makes it easy for NT to shift the blame. That's enough ranting about tech issues.

I had a very good discussion with Ziad over the weekend, which made me more conscious about risk/reward and stops. Going forward, I'll be risking 1% on each trade. Size will be calculated based on the dollar amount being risked, so setups with wider stops will have lower size, and tighter stops will have larger size. Size will be adjusted as the account grows/shrinks.

Regarding today's market action, I'm still surprised that ES broke 860; unbelievable! I mean, is it really good news that Citi needs to be bailed out by the Govt, and Govt is obliging to their request in order to "save the system"? Doesn't this just further show how much of a mess we're really in? 869 was previous week's high, so I was shorting low-mid 860s which turned out pretty good. On the negative side, I definitely let my bias get in the way and could not get myself to go long at any point during the day. I need to be able to put my bias aside and trade in the now.

Market Structure Chart (5-min)

Friday, November 21, 2008

Friday 11/21/2008 - Reset

Yesterday was the day from hell!
Yesterday I put 2 trades on in the real $ account. I bought 1 ES @ 762 with a 10-pt stop (trying to catch a falling knife), and I got stopped out with a $500 loss. I went long again with 1 contract @ 752 with a stop at 742 (again, trying to catch a falling knife). I was expecting a small short-covering rally. Unfortunately, I accidentally exited out of my 752 long position after-hours due to an order entry mistake using IB's Trader Workstation platform, which is probably one of the worst trading platforms out there. It was pretty frustrating seeing ES trading at 780+ over night. To remedy that, I ordered Ninja Trader. Aside from the trading hickups, it was just a bad day over all. I even missed my stop on the train ride back home so got off and had to catch another train going the other way to get back to my stop which ended up costing me an extra 40 minutes. There were other issues too, but no need to go into detail. It was just a really bad day.

Changes going forward
I'll be using Ninja Trader in Live Trading mode connected to IB's TWS on my Sim account with IB. At some point, I plan on switching that to my real $ IB account but don't have a set time-frame on when that will happen. Could be a week or a month, I really don't know.
I will be cutting size to 1-3 contracts. Yesterday's $700 loss made me realize I'm not ready to trade anything over 3 contracts. Most of my trades will be 1-2 contracts.

Goal for next week
The goal for next week is to play around with different stop-loss levels and finalize a tighter stop. In the past, I've been using a 5-point stop but that's probably a bit too wide. I need to find the sweet spot where the stop-loss provides damage control for the trades where I'm just dead wrong, but at the same time, doesn't wiggle me out of the winners. From similar analysis in the past, I think that's around 3 pts but next week's focus will solely be on stops and the goal is to hae a conclusion by the end of the week. Trading is all about continuosly adapting to market conditions so nothing is set in stone, but I would like to tighten up the stops a bit. Yesterday's 10-point stop didn't really provide the damage control I'm looking for. Imagine if that was on bigger size!

Setting up for failure?
Given my current situation, I wonder if I'm setting myself up for failure. The S&P is a brutal market dominated by professional traders. I'm trading against professional traders with a lot exeperience, big accounts, multiple screens, cheaper commissions and full-time focus/dedication to trading. Meanwhile, my current situation is trading part-time off a single laptop connected via a broadband card from a train with less than 25 minutes to make any trades! Sounds like I'm bringing a knife to a gun fight! I'll continue trading on the sim for a while because it provides exposure to patterns and keeps me involved in the market so if/when I go full-time, I'll have a head start but I don't know if live trading (profitably) in my current situation is realistic. Post a comment if you have any thoughts on this topic.

Thursday, November 20, 2008

Thursday 11/20/2008

This morning started off with a $3K loss, which I was able to turn around to a $700 gain by around 1 PM. The day was downhill from there though due to technical issues. Tradestation's trade server was having some issues and would not let me cancel a few Buy orders I had placed at key S/R areas. So it didn't fill the orders, but at the same time, it wouldn't let me cancel the orders either. Turns out, somehow TS filled the orders 40 minutes AFTER I had canceled them and I found myself in a Long position with 20 contracts! Meanwhile, during this 40-minute window, price on the ES had moved 20 pts away from my entry and I was looking at a big $10-15K loss. This totally screws up my stats in Tradestation, and I don't know if I should just reset the Sim account at this point, or just eat the loss and try to work my way out of it. Either way, it's very frustrating.

I'm also still struggling with the ideal stop-loss.

Lessons for the day:
NEVER try to catch a falling knife!
ALWAYS have a backup broker in case something like this happens in your real $ live account.

Equity Curve for the Day


Market Structure Chart (5-min)


This market structure / balance chart continues to put price action in perspective, while highlighting some key S/R areas. You can see how price tested the first-hour high a couple of times, and couldn't push through it, which gave way to some heavy selling. First stop on the way down was the Globex Low around the 792 area; price bounced off that area a few times. When price blows past a support area, prior support becomes resistance and that's apparent on this chart as price then bumped up against the 793 area a few times before heading down to the first hour low. Beautifully done!