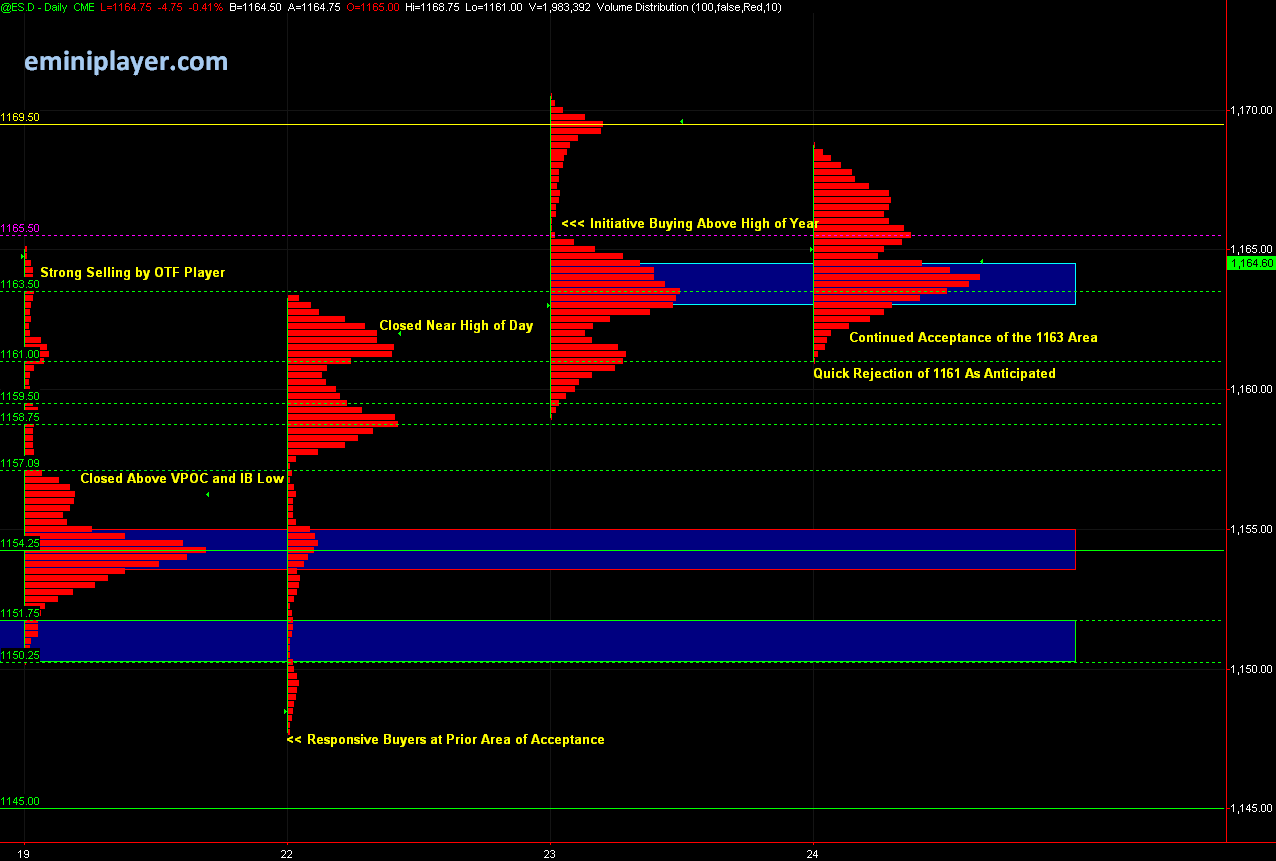
E-Mini S&P 500 FuturesSome nice action in the S&Ps today. As I mentioned in
yesterday's review, we've observed Responsive Buying and Responsive Selling all week, and today was much of the same. Responsive Sellers quickly rejected higher prices, and once price moved below 1167, Responsive Buyers quickly pushed price back up. 1167-1169 was the Area of heavy acceptance this week. This up move is losing momentum though. The previous week's high was 1176.50, and the high for this week so far is only one handle higher at 1177.50. If price gets below 1158, and longs begin liquidating, we could easily get a pullback to the 1139-1141 area.
Btw, I've received questions regarding the arrows on the 5-Minute charts I post in the daily reviews. To clarify, the arrows are NOT plotted automatically. I manually place those arrows on the charts where I see good setups (a lot of times within the Key Areas posted the night before). Some of the arrows are actual trades that I took (e.g. I shorted 1177 and went long at 1167 today). But not all of them are my trades. I don't plot all my trades on the 5-minute chart; just the setups. Hope that clears things up.
The markets are closed tomorrow for Good Friday, so enjoy the day off and have a good weekend!
ES 5-Minute Chart ES Day Session Volume Profile Chart