Showing posts with label trades. Show all posts

Saturday, January 30, 2010

My "Setup" or How I Enter a Trade

A question I'm frequently asked on the Blog is, "how do you enter the trade once price reaches your Key Area of Support/Resistance", or what "setups" I look for. Before I answer this question, I just want to put out the disclaimer that I'm in the learning stage myself, and what works for me, may not work for you.

The nightly preparation where I define the Key Levels to do business are an essential part of the setup. The chart I post every night is my Road Map for the following day, and even though I could trade without it, I would feel a little lost without the nightly preparation work. I already have scenarios in mind before price ever reaches those areas, and the scenarios are constantly being tweaked based on the latest market-generated information (price/volume). For example, if price reaches an Area of Resistance, my expectation is Rotation or a Pullback. Will price pull back 2 points, 5 points, or 20 points? I honestly don't know how much it will pullback, or whether it will pullback at all. But I anticipate enough of a pullback to allow me to move my stop-loss to break-even (generally stop is moved to break-even once price goes +6 ticks in my direction). Once price reaches my "pre-defined" Key Area, I don't have any specific "setup" -- all I look for is price to stall for a moment, and I'm in. If I hesitate, analyze or start looking for an elaborate "setup", price WILL move away from my ideal entry price, and I'll have to use a wider stop-loss to enter the trade (unacceptable to me). I am not an aggressive trader and I hate taking heat on my trades. I'm not trying to nail the top or bottom of the day, but I do try to nail the top or bottom of the current swing. I don't mind scratching trades because even my retail commissions are fairly low. Eventually I will either be working at a prop firm with member rates or will lease a seat at the CME, so I'm not worried about commissions.

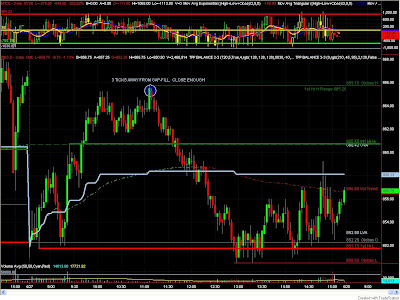
ES 233 tick-bar Chart (Execution Chart)


I'll use a trade from Friday as an example and walk you through how little went through my mind when I entered this trade. The 233 tick-bar chart above illustrates the Trade. 1066.25-1068.75 was a pre-defined area of Support off the Key Levels chart posted the night before, so as soon as price reached that "area", I began looking for a Long opportunity off the 233 tick-bar chart (execution chart). Price built a small base at 1067.50, and I pulled up the DOM to execute the trade. I entered Long at 1068.25 when I saw the offers being lifted at 1068.25 -- I want my order to be one of the last few that gets executed at that price. That's all I looked at; and that was my "setup". Price quickly moved away from my entry and began building a base in the 1069.25-1069.75 area, and I moved my stop-loss to break-even (stress-free position now). Immediate resistance was the Globex Low at 1070.50, and I scaled ahead of that at 1070.25. 1074.75-1075.00 was stronger Resistance based on the 5-minute chart, and the final target should be around that Level. Once price broke above 1070.50, immediate resistance became immediate support, and the stop-loss was moved to 1070.25, locking in +2 points on the remaining position. Price moved up again and began building a base in the 1073.00-1073.50 area, and I scaled at 1073.25 because I didn't know whether price would base and move up, or rotate down. An important point to keep in mind is that, I don't know what's going to happen next, so I must manage the trade based on the information I do have. Price then pulled back to 1071.25, just one point away from my stop-loss. When price shot back up to 1074, and began building a base at 1073.25, I exited the position completely at 1073.25 due to the time of day (2:44 PM cst, nearing market close). The final target was 1074.25, ahead of that 1074.75-1075.00 Area of Resistance.

The main point to take away from this post is that I don't look for any elaborate "setups" once price reaches my area. It takes me a decent amount of time to prepare the nightly Key Levels, and what's the use of all the preparation if I'm going to look for 30 different confirmations before I enter the trade? The whole point of preparing the night before is to improve Execution; to make it almost automatic. I can't afford to over-analyze because that would require me to widen my stop. I'd rather get in at what I perceive to be the best price at the time, and then get stopped out at negative 4-6 ticks; than over-analyze and miss the trade completely.

If you're doing the preparation and homework ahead of time, you don't need elaborate "setups". Wait for price to get to your area of business, and then execute the trade. Whether you look for divergence on some oscillator, or NYSE TICK divergence, or something else -- it really doesn't matter, so long as the method gets you IN the trade. As an example, check out the following 1-min chart with NYSE TICK. I haven't looked at this chart in several months, but you can see how we had positive NYSE TICK divergence going into that 1067.50 Low.

ES 1-Minute Chart with NYSE TICK


In conclusion, my advice is to do the homework and preparation, analyze the overall context based on the day's action, and once price reaches your area of business, just focus on executing the trade. If you're a new trader, use a wider initial stop-loss to compensate for (lack of) precision.

I hope you found this post helpful. If you have any thoughts on this subject, please post in the Comments.

Saturday, November 21, 2009

OpEx Friday - 11/20/2009 Review

Friday played out beautifully, and the scenarios put together on Thursday night provided the preparation necessary to trade the price action in real-time. In the bearish scenario, a test of 1082.50 was anticipated below 1087, and we got that move in the overnight session at 6:10 am (cst): price hit a low of 1083.50, and closed at 1084.50 on the 5-min chart. I was anticipating a test of 1082.50, so not testing 1082.50 is also a valuable piece of information. That 5-minute candle at 6:10 am is a wide-range bar with heavy relative volume (heavy considering the time of day), and I would view it as a significant candle in terms of support/resistance. Mark the open/high/low/close of that bar - the levels could (and did) act as support/resistance in the near-term. Now observe the price action following that candle; price stabilized at the 1084.50 level and broke through the high of that significant candle (1087.50) at 7:30 am (cst). From there, price moved up and hit resistance at 1092.75 (Thursday's POC), and we then sold off all the way down to 1085.25 (78.6% retracement). What does this mean? Is it bullish or bearish? Well, lets see, if the sellers were really in control, I would expect a test of 1083.50, so score one for the bulls for halting the down move at 1085.25. Price then retraced back up to 1088 (a tick above the cash open at 1087.75), and sellers came in again, but this time, they could only push it to 1085.50. Again, if sellers were dominant, I would expect price to test the previous swing low at 1085.25. That didn't happen. Based off this information, I entered Long at 1086 with a 6-tick initial stop, which was moved to break-even once price broke above 1088. The stop was moved to 1088 (+2 pts) once price broke above the mid-point (1089.25). Price came within a tick of triggering the stop, and the exit was at 1090.00. Btw, I had a couple of other small trades prior to this one, but they were tiny winners (4-6 ticks), so I chose to detail out the setup that had some structure to it.

Options Expiration Friday
I checked out the chart from October's OpEx Friday (10/16/09), and see a lot of similarities between 10/16 and 11/20. I wasn't concerned with the absolute values/prices on each day; just the directional swings. Lets do a little compare & contrast between 10/16 and 11/20 and look at the similarities:
  1. Price sold off in the overnight session on Both days.
  2. Price retraced back up into the cash Open
  3. Price stalled and reversed within the first 30 minutes of the open. Price began reversing down at 8:45 am on 11/20, and at 8:55 am on 10/16. The exact times aren't really important, but it's an interesting coincidence.
  4. Price retraced back down on both days. Price broke below the Globex Low on 10/16, but wasn't able to get to the Globex Low on 11/20.
  5. Price then chopped around, and moved higher into the previous day's POC on 10/16 and 11/20.
  6. Price moved back down into the close, and the down swing began at almost the same times on both days.
Looking at price action for similar days in previous weeks/months is not a part of my trading plan. I just did this exercise because I saw many similarities. I don't know if there's any merit to looking at similar days in the past to get a heads-up on price movement, but I found this to be pretty interesting. If you have any thoughts on this, or have performed similar comparisons in the past, please post in the Comments section.

ES - 5-Min Chart (November 20, 2009)


ES - 5-Min Chart (October 16, 2009)

Wednesday, June 10, 2009

Wed. 06/10/09 - A lot harder than it looks

A lot of newbies jump into the markets in hopes of "easy money". They read about the (very few) successful traders, their high roller life-styles, ability to work from anywhere in the world, etc. and jump into the market with dreams of grandeur: making thousands or millions while sipping a cocktail on a sandy beach. Trading is so NOT like that. It's an extremely challenging and difficult way to earn a living. It tests you mentally, physically and psychologically all at once. Right when you think you've got it figured out, the market proves you wrong and tests your confidence. The charts are also VERY deceiving since they make it look so EASY in hindsight. Show any newbie a 5-min chart, and they'll be quick to point out how much money you could make (ironically self-acclaimed gurus also use this trick). To cut it short, this shit ain't easy so think more than twice before you jump in, and even then, don't do it for the money.


I made around $80 bucks today, and they were probably the hardest $80 I've made in my life. I was talking to Matt on Yahoo IM when I placed and exited a trade for a profit, and I told him "I've never been so happy making so little" LOL - and trust me, it wasn't because I made a few bucks, I was happy because I finally executed a trade according to plan, and was rewarded for it. I was acting like a bitch most of the day; hesitating on all my setups, not entering the market when I should, etc. I'll go over a few trade setups that I would have taken on Sim but for some reason, did not take now that I'm Live. Here's how my day went...

ES (5-Min) - Pre-Market Short-Sell Setup

I really wanted to short at 950 in pre-market, but hesitated thinking "I should wait till market opens and let the opening range get set". I then thought "I should place a sell stop 2 ticks below the 848.50 level in case we get a sell off at the open"...and even put in the order, but later pulled it out thinking "946.50-947 is support - why short so close to support?". Missed some nice down-side action. Lets move on to the next area...

ES (5-Min) - 9:00 AM Central - Trade #1

Over here, I see that the 944.25 area held and is a potential double-bottom from the over-night price action, and I think we'll rally back up now so I hit it Long at 944.75 with a 1-pt stop-loss; a "low-risk" trade in my mind. Price moved so fast against me, I got 1 tick slippage on my stop taking a 5-tick loss. In hindsight, I should have waited for a bullish candle to close above 947.25 and then looked to perhaps buy a pullback. That should have been an indication that price was set on heading lower, but we've had such choppy price action leading up to today, that the possibility of a strong trend down day didn't really cross my mind. Moving on...

ES (5-Min) - 9:45 AM Central - Not Going Long Now

Plenty of support at 939.50, but after taking that prior loss, I decided to stay away from the Long side. Was looking to enter short on a retracement back up to the 944 area but price didn't get there.

ES (5-Min) - 12:00 PM Central - Treasury Auction Coming Up

At this point, I'm glad I stayed out of Longs and am shocked that ES is testing the 936 area. This was a pretty solid area. I look at the consolidation heading into the treasury auction and place a buy stop at 941.50 and a short-sell stop at 935.50 to catch the move in either direction. At the last minute, I bitch out, and pull my sell-stop order thinking "934.50 is support so why risk 6 ticks just to make 4 ticks".

ES (5-Min) - 12:55 PM Central - WHY did I pull my sell-stop at 935.50?!?

Frustrated as all hell now - Wondering if I'll ever make it in this business. Will 932.00 hold? Holy sh*t! How low can this market go? Don't you shorts eventually have to COVER? Come on!

ES (5-Min) - 1:40 PM Central - Trade #2

OK - finally seeing some signs of a bottom. Would like to short if price gets back to mid-point and/or VWAP but for now, this could be a nice scalp to the Long side. Hammer at the lows followed by a strong bullish candle. Should try a Long at the mid-point of the bull candle. Was tired of missing so many trades, so manned up at entered Long at 930.25 with a 6-tick stop. Price moved up fast to my target 933.25. I was actually expecting price to get back to 935.50 area but I didn't want to over-stay since this was a counter-trend setup. At this point, I was too emotionally and mentally drained so called it a day.

ES (5-Min) - I can't believe price retraced back up to over 940 this late in the day!


What a day! Glad it's over.

ES (Daily) - Bull Flag?


The Daily chart is still looking bullish to me. Looks like a bull flag on the daily, and we now have 4 dojis in a row, and we're at the low end of the up channel. Will we get a break-out tomorrow? Who knows. I certainly don't! Retail Sales and Jobless Claims data out at 7:30 AM (central) tomorrow morning. Trade well!

Tuesday, June 9, 2009

Tuesday 06/09/09 - Live on the Real $ Acct

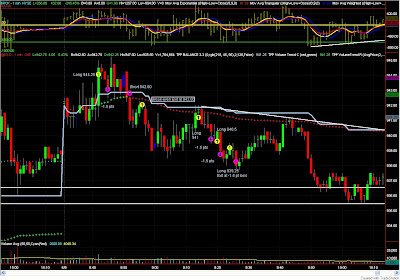
I switched over to the Live/Real $ account yesterday. No matter how much time you've spent on the Sim, the transition to the Real $ account always brings about some psychological hurdles that one has to work through. That may not be the case with a new trader who starts on Sim, and then switches over to real $, but for someone who's made hundreds of trades with dollars on the line (me), it brings back some old memories and fears. I traded piss poor yesterday placing 3 scalp trades for +1 tick each because for some weird psychological reason, I really wanted my first day on Live trading to be positive.

After realizing that this was a big problem, I looked back at my journal from late 2003 and noticed that "early exits" were a problem even back then. To help solve the problem, I figured I would be more patient and give my trades time to work. Problem is, when you're entering fundamentally bad trades, the additional time only works against you. And that's what happened today. I gave my trades time to work; and that resulted in me taking full stop-outs on almost ALL of my trades today (-1.5 pts per trade). Ironically, I gave all the losers time to work, while cutting the good trades short at break-even.

ES (1-Min) - Morning Trades


I went Long in the morning after it looked like price wasn't going for gap fill and was stopped out for -1.5 pts. After seeing the momentum shift to the downside, I entered short at 942.00 except this time, I was quick to move my stop-loss to break-even, so I got stopped out at break-even on a good entry. After that, the gap filled, and I figured we were ready to resume the up move and began hitting it Long and giving it time (to hit my stop-loss). The three Long trades that followed were fundamentally poor trades from the get go, and didn't even go with my method. I guess those could be classified as "revenge" trades :-/ After being down -5.75 pts, I figured it was best that I stop and come back in the PM session.

ES (1-Min) - Afternoon Trades


My friend who I'm teaching was sitting right next to me, trading his own real $ account, and he entered Long at 945.50 area on the break-out of the first hour high. I told him that 946.50 was resistance from yesterday's high so it's probably best that he stay out until we get a confirmed break-out above that area, and then he can enter Long on a pullback. It'd be sweet if I followed that advice myself. Instead, I got caught up in the price action, and hit it Long at 946.25 and was stopped out a minute later. I then immediately entered short at 944.50. That trade went a point or so in favor and then retraced back up...I had already moved my stop-loss to break-even and missed the down-side action that followed.

So to summarize, I traded like an idiot today and did the complete opposite of what I should have been doing. I held the losers and cut winners at break-even. Now I can either beat myself up over an almost $400 loss, or I can try to learn from my mistakes and make a better effort later in the week. I'll go with the latter. Plus, no one day should make/break a trader. I'm just glad I didn't do too much damage.

Any comments/advice appreciated. I'm not posting the stats because they're obvious from the trade chart (5 losers, 2 scratch trades, -7 pts).

ES (60-Min)

Friday, June 5, 2009

Friday 06/05/09 - Short Day For Me

Busy with several errands today (wrapping up the remodeling of my condo in downtown Chicago), so was distracted most of the morning with phone calls, and was in/out of my home office so missed that nice short setup. Have to head to the city now. Made a tiny +3 pts, even though I was short at 950 before the big drop, and Long at 940.25 before the retracement back up. At least I was right directionally. I'll probably update this post later tonight with some updated charts, etc.


ES/$TICK (1-Min)


ES (5-Min)

Thursday, June 4, 2009

Thursday 06/04/09 - Specialize in ONE Market

I didn't post anything on Tuesday because the day was spent on group trading education/mentoring with a couple of friends at my place.

Yesterday, I got the genius idea of trying out the mini-Russel 2000 futures (TF), and I thought I could just pull up some TF charts; adjust the time-frame on the tickbar charts and dive right in. Talk about being naive! The TF moves has its own rhythm compared to the ES, and over the course of the last few months, my mind has been trained to be in sync with the moves on the ES. I traded the TF in the morning, and was down -1.2 pts, which isn't too bad, but I quickly learned that you can't just jump into a new market/index without some research and dedicated screen time. Then later in the evening, I happened to be at Barnes & Noble and was browsing through John Carter's book in which he states that newer traders should start with the Mini-Dow (YM) since it's an "easier" instrument to trade, and has less professional participation. I figured I'd give it a shot, so I went over the Daily, 60-min, 15-min and 5 min YM charts, and set up my charts to trade the YM this morning. Again; not a great idea. I ended the first hour at break-even and then came to my senses and switched back to trading the S&P500. That was a good call. It was like I was back in my old neighborhood; in familiar territory. I traded the ES from 9:30 AM (central) till about 1 PM and netted +7.50 pts. This little exercise in trading the TF and YM showed me the importance of specializing in ONE market. The ES moves in a certain way, and after watching if for several months I've become comfortable with the way it moves. Over time you get a feel for how a certain market/instrument moves; to the point where you can get a feel for short-term direction just by looking at price action on the DOM. So no more dabbling in other markets trying to find the "easier" one to trade. Here are the Stats from today's trades in the ES:

# of Trades 18
Longs 11
Shorts 7
% Break-Even: 16.67
% Win 66.67
% Loss 16.67
Avg Win 0.85
Avg Loss -0.92
Largest Win (pts) 2.00
Largest Loss (pts) -1.50
Total Win (pts) 10.25
Total Loss (pts) -2.75
Net Gain/Loss (pts) 7.50
ES Daily Range 14.00
P/L as % of Daily Range 53.57

Not sure how many of you use Twitter, but I use it to document my thoughts and what I'm seeing Intraday. I'm also on StockTwits. You can go here: http://stocktwits.com/u/eminiplayer if you'd like to go over my posts and intraday charts from this morning highlighting support/resistance, $TICK Divergence setups, etc. Following are a few of my Twitter posts from today:
10:19 AM - Bulls in control as long as price remains above 835.50 on a 5-min CLOSING basis
10:24 AM - http://twitpic.com/6lok3 Good place to take some profits on Longs $ES_F Also seeing negative $TICK divergence on 1-min
10:27 AM - Shorted the pop into overhead resistance and negative $TICK divergence http://twitpic.com/6lp83
10:59 AM - Trying a scalp short with tight stop-loss here http://twitpic.com/6lr0k
11:02 AM - Out for +2 pts http://twitpic.com/6lr9h
11:16 AM - Some support here http://twitpic.com/6lse9
12:47 PM -$TICK Divergence providing some nice scalps today http://twitpic.com/6lzvp
12:56 PM - 938.50 important area for Longs IMHO
2:00 PM - Prior Resistance, now Support. I would avoid 938-942 or Scalp the range. http://twitpic.com/6m62t - Done for day at +7.50 pts
2:01 PM - Negative $TICK divergence throughout the last hour http://twitpic.com/6m679


Report on Employment Situation out at 7:30 AM tomorrow. Going forward, I'd like to see price remain above 916.50 on a Closing basis for Bulls to remain in control. We also need to be mindful of overhead resistance at 950. Following two charts show the "big picture" structure I'm working with.

ES (60-Min)


ES (Daily)

Thursday, May 28, 2009

Thursday 05/28/09 - Running on Empty

Today was bad from the get go; no motivation, lousy focus, and lack of sleep weighed on me, and I missed some nice trade sequences in the morning. The mind just wasn't sharp enough, and I was still half asleep when I got to the screens around 9:00 AM (central). Just felt super tired all day. I wasn't around much for the afternoon since I had to take care of some additional paperwork. I got back to the screens around 2:30 PM and placed 3 more trades into the close (2 winners, 1 loser). All in all, a pretty bad day but somehow managed to end with a +3.75 pt gain. For the full-time traders, how do you maintain focus throughout the day? Here are the Stats:

# of Trades 7
Longs 3
Shorts 4
% Break-Even: 0.00
% Win 57.14
% Loss 42.86
Avg Win 1.81
Avg Loss -1.17
Largest Win (pts) 2.50
Largest Loss (pts) -2.00
Total Win (pts) 7.25
Total Loss (pts) -3.50
Net Gain/Loss (pts) 3.75
ES Daily Range 22.50
P/L as % of Daily Range 16.67

GDP out at 7:30 AM tomorrow morning, Chicago PMI at 8:45 AM, and Consumer Sentiment at 8:55 AM.

ES (5-Min)


ES (Daily) - Lower high and lower low, with a Close near the highs on today's Daily candle. Support in the mid 880s below.

Tuesday, May 26, 2009

Tuesday 05/26/09 - Parabolic Moves Suck

I don't like trading days like today where there's a quick parabolic move followed by a slow grind. I've seen these types of days before so I traded it as I knew best, which was by identifying the consolidation ranges and buying towards the bottom of the range. I'm glad I didn't attempt to Short the move, although I have to say the temptation was most certainly there. The disappointing part is, I had a Buy signal at 885 prior to the Consumer Confidence news, but didn't take it because I saw (perceived) weakness in the Energy sector (XLE). Perhaps I'm putting too much weight in the Energy and Financial sectors, and should just use them as a general barometer, rather than a criteria for trade entry. Any thoughts on this would be appreciated.

I only took three trades today so I'll go over them (Chart attached below)

Trade #1
Entered Long on small pullback at 900 around 9:30 AM (central). Moved stop-loss to break-even when position went 6 ticks in favor. I was stopped out at break-even a few minutes later, and price moved 4+ points in my favor immediately after I was stopped out (doh!)

Trade #2:
Entered Long at 904.75 around 10:50 AM. I definitely entered a bit early on this one; should have entered at 903.75, but it is what it is. I was using a 2-pt stop-loss, and price hit a low of 902.75 at 11:10 AM, and I was promptly stopped out for -2 pts. That was the Low point of the swing, and price didn't touch 902.75 for the remainder of the session (luck was def. not on my side today).

Trade #3:
Entered Long at 903.00 around 11:15 AM with a 6-tick stop-loss. Let this one run for +4 pts, and exited at 907.00 around 11:50 AM. I was expecting price to head higher, but didn't want to be greedy (Friday's Stop-Loss experiment showed that it's good to take profit once price has moved 4-5 pts in favor). I called it a day at this point since price was just chopping around.

ES (5-Min) - Trade Chart


Stats:

# of Trades 3
Longs 3
Shorts 0
% Break-Even: 33.33
% Win 33.33
% Loss 33.33
Avg Win 4.00
Avg Loss -2.00
Largest Win (pts) 4.00
Largest Loss (pts) -2.00
Total Win (pts) 4.00
Total Loss (pts) -2.00
Net Gain/Loss (pts) 2.00
ES Daily Range 32.75
P/L as % of Daily Range 6.11

Lot of Econ News out this week so there should be plenty of volatility in the markets. Expecting support at 893 and resistance at 916 and 923. Existing Home Sales data out at 9:00 AM tomorrow. Btw, I won't be trading tomorrow since I have to head to Downtown to take care of all the paperwork for the new job.

ES (Daily) - Today's bullish candle on the Daily took out the bearish movement of the previous 3-4 sessions.

Friday, May 22, 2009

Friday 05/22/09 - Stop-Loss Experiment

I went to bed around 2:30 AM last night, and slept in till 9:30 AM this morning. I got to the screens around 10:30 AM (central), and saw that price had bounced off 882, an area that I marked as support yesterday. I utilized just the 5-minute chart for trade placement today, and my focus was to experiment with my stop-loss management. I decided I would let the trade run and move my stop-loss to break-even once price had moved 2 points in my favor. My initial profit target was 4 points (1:2 R/R). I had a total of 3 trades.

Trade#1
I entered Long around 10:55 AM at 890.50 with a 2-pt stop and an initial 4-pt profit target. Once price moved 2 pts in my favor, I moved my stop-loss to break-even. Price then went 3 pts in my favor, at which point, it looked like I should exit the trade but I had to stick with the 4 pt target for this experiment's sake, and was exited at break-even around 11:25 AM (central).

Trade #2
I entered Long around 11:30 AM at 890, again with a 2 pt stop and 4 pt profit target. Once price moved 2 pts in favor, I moved the stop-loss to break-even. Price then continued and was +3.75 pts in my favor, a mere 1 tick away from my exit order. The 12:10 PM (central) candlestick signaled a reversal and I could have bailed for +3 points, but I stuck with the experiment and once again was stopped out at break-even at 12:35 PM.

Trade #3
I entered Long around 1:00 PM at 890.50, with a 2-pt stop and 4 pt profit target. I actually had to leave the house at this time, so put in the bracket orders for stop and profit, and left the PC. On this trade, price finally hit my profit target for +4 pts at 2:15 PM (central). The 2:20 PM candle would have signalled a short entry for me, but I wasn't at my desk.

ES (5-Min) - Trade Chart


I realize one day's price action doesn't say much, but it looks like I need to give my trades some room in the beginning. Moving stop-loss to break-even at +2 pts sounds reasonable from a risk management perspective. But then if I see a reversal signal, I also need to go ahead and exit at a profit. I easily left 3 pts on the table on my first two trades, so this could actually have been a +10 pt day in just 3 trades if I used discretion and exited the first two trades at a profit. Here's the Stats break-down:

# of Trades 3
Longs 3
Shorts 0
% Break-Even: 66.67
% Win 33.33
% Loss 0.00
Avg Win 4.00
Avg Loss 0.00
Largest Win (pts) 4.00
Largest Loss (pts) 0.00
Total Win (pts) 4.00
Total Loss (pts) 0.00
Net Gain/Loss (pts) 4.00
ES Daily Range 13.50
P/L as % of Daily Range 29.63

We have an open gap at 899.50, and at this point, the 876-882 area has proved to be support. Lets see if that holds next week. Have a fun and safe memorial day weekend!

ES (Daily) - Zoomed In. Price made a lower high and higher low today.

Monday, May 11, 2009

Monday 05/11/09 - Forward Testing

Initially, I manually back-test new ideas on past charts, but to develop faith and confidence in the method, it must prove itself in real-time (forward-testing), and I certainly place more emphasis on real-time testing. I added the S&P 500 Adv-Decl Issues Diff ($ADSPD), the NYSE Adv-Decl Issues Diff ($ADD), the NYSE Up-Down Volume Diff ($VOLD) to my charts to more closely monitor market breadth so today was spent experimenting in real-time. The morning was spent exlusively on experimenting with different setups and resulted in a -6.75 pt loss. In the afternoon, I switched gears back to my existing method and banked +7.00 pts to end the day in the green by 1 tick (minus commissions). I will continue studying the newly added market breadth indicators to get familiar with them. I didn't expect to make much off the added information on the very first day so I'm not at all disapponted. It was good to see that I could make it all back trading the way I already do, in a narrow range market which isn't condusive to my style of trading since I look for trend continuation, range extensions and break outs. Here's how the Stats broke down for today:

# of Trades 31
% Break-Even: 12.90
% Win 51.61
% Loss 35.48
Avg Win 0.95
Avg Loss -1.36
Largest Win (pts) 3.00
Largest Loss (pts) -1.75
Total Win (pts) 15.25
Total Loss (pts) -15.00
Net Gain/Loss (pts) 0.25

A pullback is not only normal, but healthy after a rally, so today's down move is fine by me. We also filled the open gap at 907.75 from last Friday. I just hope it turns out to be bulls re-fueling, rather than a total reversal in trend. I trade short-term so it really doesn't affect me whether the market moves up or down, so long as it MOVES, but I'd like to see further upside movement to at least the 940 area on the S&P. I'll be watching the 901 area for support, then 898, 894.75, 891, 887 and 881. On the upside, I'll be watching the 910 and 914-918 area for resistance. We also have an open gap above at 924.25.

ES/$TICK (3-Min) - Open Gap above at 924.25

Wednesday, May 6, 2009

Wed. 05/06/09 - Solid trades

I was busy most of the day with some web development work for one of my clients (sim trading doesn't pay well), but I kept my 3-minute chart up on one of my screens and took a few setups today which resulted in a net gain of +10.75 pts, and that's with a couple of bad entries where I got stopped out, and a couple of early exits. Using the 610 Tick Bar chart in conjunction with the 3-minute would have helped me time my entries better. The newly implemented Trading Schedule also really helped! I would grade today's trading as a solid B+. I've marked up some of the trades on the 610 Tick Bar charts below.

Going forward, I'll be looking at the 910 area to provide light support; 900 area to provide solid support, 887-890 underneath that level as support "foundation". A pullback on profit taking is to be expected, but until those areas are taken out, the market's bias is bullish in my opinion.

Jobless Claims and Productivity and Costs data out tomorrow at 7:30 AM (central). Ben Ber"tank"e speaks at 8:30 AM, but that should be a non-event, EIA Natural Gas Report out at 9:30 AM.

On to the charts...

ES 610 Tick Bar Chart (Morning Trades)


ES 610 Tick Bar Chart (Afternoon Trades)


ES 610 Tick Bar Chart (Late Afternoon / Closing Trade)


ES/$TICK (3-Min) - Gap filled by 9:30 AM. $TICK MAs above zero most of the day.

Monday, May 4, 2009

Monday 05/04/09 - ES Over 900 (Finally!)

I've been expecting (hoping for) a break above 900 for a while, so it's good to see it finally materialize. Unfortunately, price didn't pullback much so it was tough finding a good area to buy. If you didn't buy on the pullback to 889, you were left trading consolidation chop. My problem is, after ES makes a big up move, I have a hard time entering Long because I feel like price is "too high" and will reverse on me. Price has reversed hard so many times off the intraday high in the past few weeks, that it's a little scary buying above the first hour high; especially when price is so close to 900, which a lot of people perceive as a psychological barrier or resistance zone. Bottom line is, I need to set my biases aside and trade price. As day traders, we don't buy/sell value so the specific price shouldn't matter. We trade momentum. So as long as momentum is supporting the direction of my trade, I shouldn't be afraid to get in. Here's how today broke down in terms of performance across 18 trades:

% Break-Even: 31.58%
% Win 47.37%
% Loss 21.05%
Avg Win 1.00
Avg Loss -0.425
Largest Win (pts) 2.00
Largest Loss (pts) -1.50
Total Win (pts) 9.00
Total Loss (pts) -4.25
Net Gain/Loss (pts) +4.75

At this point, I'm looking for 879 to hold as support on a pullback.

I'll post a marked up 610 tick bar trade chart; it doesn't have all of my trades, just the ones I had time to mark in real-time. I'm using Infinity's execution platform so the trades aren't auto-plotted on my TradeStation charts now.

ES 610 Tick Bar Chart (Morning Trades)


ES 610 Tick Bar Chart (Afternoon Trades)


ES/$TICK (3-Min) - Open Gap at 876.50


ES (60 Min) - Looking for 879-886.75 as an area of support on a pullback

Friday, May 1, 2009

Friday 05/01/09 - Positive Day

I only traded for a couple of hours today (10:30 AM - 12:30 PM central) since I was at the condo in the morning, and busy with other errands in the afternoon, and although today's P&L reads +$212.50, I'm much more satisfied with my trading today (grade of B-) compared to yesterday's +$1,100 gain, which I graded as a C-. My discipline was better today, although there's still room for a ton of improvement. You can check the Trade Chart to get an idea of my primary trades for the day, but basically, scalped long at a support level; scalped short at trend-line resistance, and then scalped long again once trend-continuation was confirmed, and exited on the stop-run that ensued once ES broke to a new high of day. That's it...pretty simple and straight forward trades today.

ES 610-Tick bar Chart (Trades)


My bias continues to be to the upside. At this point, if ES breaks below 850, bias switches to neutral. A break below 830 and the bears are back in control. That's all for today folks! Have a nice weekend :)

ES/$TICK (3-Min) - Gap filled within the first 20 minutes of market open. Over 100,000 contracts traded at the close with an 8 point up-move; I'm guessing that was mostly Shorts covering their position.


ES 60-Min - Bounce off the 50% retracement; Close above the 23.6%. Lookin good for the Bulls

Tuesday, April 28, 2009

Tuesday 04/28/09 - Indecisive price action

I won't bore you with the excuses (although I have a few), bottom line is, I didn't adjust to the market's pace (or lack of), and got chopped. There just wasn't any follow through on the moves today; my trades would go 1-2 points in favor, but my targets were usually 3-4 points and I would try to be patient and hold out for target, and instead get hit with a loss since price would reverse hard! I had 25 trades today (32% win rate) with 3 Longs (all losers), and 22 shorts (36% win rate) and ended the day with a net loss of -$310 ($157.20 lost on the 3 Longs, and $152.80 lost on 22 shorts). At least I kept it tight. I made several mistakes. First mistake was trading while I was mentally frustrated and physically occupied with non-market related issues, and not "in the zone". Second, I got sucked into trading the afternoon range-bound chop, and reversed my position several times which resulted in several small losses. I should have just waited it out, but I really thought the market was going to drop to at least the 851 area, and wanted to be positioned short into the drop. After I was down over $300, I decided to call it quits, and of course we got the break-down in ES right after I quit for the day (so frustrating!). And that brings me to an important question: Should I impose a loss-limit while I'm on the Sim? I would definitely have a loss limit on the real $ account, and it makes sense to treat the Sim trading as close to real $ trading as I possibly can. But on the other hand, I miss out on additional screen/trade time if I quit early in the day. Post your thoughts in the comments.

An update on my friend; he netted +$55 or so today after commission. Not bad at all considering the price action.

GDP at 7:30 AM (central) and FOMC Meeting Announcement at 1:15 PM (central) tomorrow.

ES 233-Tick Bar Chart (Morning Trades)


ES 233-Tick Bar Chart (Afternoon Trades)


ES/$TICK (3-Min) - TICK MAs were hovering around the zero-line most of the day; indicative of the indecisive market action today. We got the gap-fill at 9:42 AM (central)

Monday, April 27, 2009

Monday 04/27/09 - One for the bears

I used the Infinity AT platform for my trades today so I won't be posting the usual TradeStation trade execution chart. I manually marked some of the morning trades, and will post that chart below. The net gain on the day was +$300, mostly due to a Long entry at 858 off a pullback, which netted +5 points. I was trading 1 to 2 contracts today; although majority of the trades were with a 1-lot. The net gain would have been higher but I tried trading the open, and lost some money during that time period. I was long at 851.50 right off the open, but was too quick to move my stop-loss to break-even! I'm not used to trading the open and need to adjust my risk management to handle the volatility during the opening range. Of course I always have the option to just sit out during that time, but some of the best entries over the past few days have been very close to the open. Plus, I was expecting gap-fill, so wanted to enter Long at the best available price. I also had limited screen time since I was on the phone with recruiters, etc. Here's a 610 tick bar chart showing a few of the morning trades; there were a couple of losers during the opening range which aren't marked on the chart.


My friend who's learning how to trade the ES, ended the day with a net gain of +$350, and his trades were all based on the simple price action method I taught him last week. I'll keep you guys posted on his progress over the coming days/weeks.

Redbook out at 7:55 AM (central) and Consumer Confidence at 9:00 AM (central) tomorrow morning. I'll probably sit out the first hour. Trend is down at the moment; lets see if tomorrow's data can shake things up :-)


ES/$TICK (3-Min) - Came within 3 ticks of gap-fill; close enough to be considered filled.

Sunday, April 26, 2009

Friday 04/24/09 - Be aware of Market Moving News

Started a bit late on Friday morning due to the economic data being released in the morning. It's safer to let the market digest the data, and then enter trades based on some fresh support/resistance levels. I essentially had two trading ideas/sequences on Friday. The first trade was entering Long at the 857 area with an expected initial target of 860.75. That worked out OK for me and then I sat on my hands for the next move. The next area in-play was 860-865.25. My plan was to short a break of 860 (I had a sell stop order in at 859.75) or to buy a break-out of 865.25 with a 3-4 point target in either scenario. I was aware that some "stress-test" related news was going to be out at 1:00 PM (central), and based on price action (trend was up), I was long at 861 with a reversal-stop at 859.75. Seemed like a safe play at the time. Once the news came out, I got stopped out of my Long position, and entered into a Short position, but the move came in so fats & furious, that my short position got stopped out for a 2 point loss on that swing up. I entered long again expecting the up-side to continue since we were in an up-trend prior to the news. But, I got stopped out yet again, so I again, entered short around 860 and exited around 855 (853 was a support level). I ended my trading day there at 1:15 PM (central) with a net gain of +$425.10 with a win rate of 38.4% and an average profit factor of 1.64 (the profit factor on my short trades was 8.85!). I could have certainly handled the situation better by NOT entering Long simply because price reversed after that break of 860. That would have saved me a few hundred in losses. The better play would have been to remain flat into the news, and then enter short on break of 860 with a tight stop or enter long on a break-out of 865.25. Lesson learned! Here's a snapshot of my 610 Tick bar chart from Friday. It should give you an idea of what I look for, and how I read price action:


Looking at this past week's results in TradeStation, my net gain on the week was +$897.40 with a win rate of 39% and an average profit factor of 1.53. This number doesn't include the gains from Tuesday, when I was experiencing technical problems with TradeStation (caused unnecessary losses), and used the Infinity AT trading platform. If I count those trades, the weekly gain would probably be around +$1,600.

Going forward, I'll be looking at 868.75, 872, 878 and 883 as possible areas of resistance. I'll be looking at 860, 850, 848.75 (OPEN GAP) and 833 as areas of support. Hoping for continued upside action!

On to the regular charts...

ES/$TICK (3-Min) - Open Gap at 848.75 Below


ES 15-Minute - Price above 34 and 200 EMA. 850 level held support.

Thursday, April 23, 2009

See One, Do One, Teach One

"See One, Do One, Teach One" - I first came across this phrase in Dr.Brett Steenbarger's book, and upon doing a quick Google search, here's a definition I found for this phrase: "A traditional format for acquiring medical skills, based on a 3-step process: visualize, perform, regurgitate". If this form of learning can be applied to something as critical and difficult as medicine, then why not apply it to trading? I bring this up because one of my friends recently asked if I could teach him how to trade, so I spent an afternoon with him going over the price action charts I post on my Blog, and then handed him a copy of Reminiscences of a Stock Operator, which he has almost finished reading. Today he came over to watch/trade the market in real-time at my place, and he performed really well! He was able to net +$112.50 in 2 hours trading the ES. Now keep in mind, today was the first time he ever saw a chart of the ES in real-time, and he got these results armed just with Reminiscences of a Stock Operator and the basics I covered with him in one afternoon (support/resistance, trend, reading price action and identifying higher-highs/higher-lows/lower-highs/lower-lows, and the definition of a candle-stick). That's IT! Going over the charts with him in real-time further enforced the trading principles in my own mind. Dr.Brett recommends saying your thoughts aloud because listening to yourself forces the mind to re-analyze the idea, and some ideas "sound" incredibly stupid once you say them aloud. Now he also placed some bad trades, which I recommended him to stay out of, but he wanted to get into them anyway, so for the sake of education (learning from mistakes), I entered him into the trades on Sim, and we promptly lost -$225.00. If we discount the two bad trades, the net profit on the day would be +$337.50.

My point is, teaching someone else how to trade will probably make you a better trader (+1 for karma, I suppose). So lets share knowledge and become better traders.

Durable Goods Orders out at 7:30 AM (central) and New Home Sales data out at 9:00 AM (central) tomorrow morning. Aside from that, the 830 level held today so that's a good sign for the bulls. I'm hoping for continued movement to the up-side.

ES 610-Tick bar Chart (Trades)


ES/$TICK (3-Min) - Gap filled by 9:03 AM (Central)


ES 15-Minute - Price above 34 and 200 EMA. 830 level held.