Showing posts with label Retail Sales. Show all posts

Friday, March 12, 2010

Friday 03/12/2010 - E-Mini S&P 500 Futures Review/Analysis

E-Mini S&P 500 Futures Review/Analysis
So the first move above 1150 got sold into; what a surprise (sarcasm). Price bounced ahead of the Overnight Support Level (1141.75), and was well accepted in the 1143.50-1146 area, closing above VWAP, Previous Close and the Day Session Midpoint. Aside from the overbought conditions, I'm not seeing any signs of weakness and price could very well continue moving north into next week. I'm open to a 2-3% pullback, but also can't close my mind to upside continuation. As day traders, we have to be prepared to take advantage of price movement in either direction. Have a great weekend!

ES 5-Minute Chart


ES 30-Min Volume Profile Chart

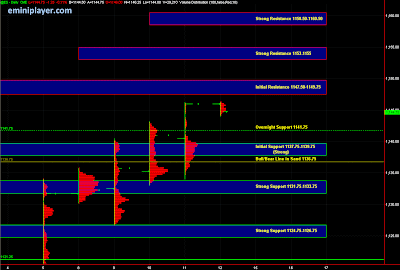
Friday 03/12/2010 - S&P 500 Futures Key Support/Resistance Levels

E-Mini S&P 500 Futures
Price is getting very extended up here, and a breather would be a good thing at this point since it would allow Buyers to re-load at better prices, and may even attract additional capital currently on the sidelines. The challenge at this point is to keep the bearish bias in check, and view price objectively. My Bull/Bear Line in the Sand is 1136.75; bullish above and bearish below that level. Risk management is Key here since a move down could result in some profit-taking, which could trigger a stronger sell-off. Bears are waiting and will probably pounce on this thing at the earliest glimpse of a selling opportunity. Trade well!

Econ Data
Retail Sales at 7:30 AM (cst), Consumer Sentiment at 8:55 AM (cst), and Business Inventories at 9:00 AM (cst). Treasury Secretary Tim Geithner speaks before the U.S. Export-Import Bank annual conference in Washington at 11:00 AM (cst).

ES - Daily Chart with Volume Profile and Key Levels

Sunday, February 14, 2010

Friday 02/12/2010 - E-Mini S&P 500 Futures Review/Analysis

E-Mini S&P 500 Futures Review/Analysis
Had a great time on Friday, although those afternoon pullbacks went a little deeper than I expected. On the late afternoon pullback, we had Mid-Point, VWAP, and IB High as Support, which provided a solid bounce with a close at the High of Day. Given the strong close, I'm anticipating continuation into the next trading session. It looks like price could have gone higher but ran out of time.

Btw, I will begin trading Crude in the near future so if I get time, I may post Key Levels and Review for Crude as well.

ES 5-Minute Chart for 02/12/10


ES 30-Min Volume Profile Chart for 02/12/10


ES Day Session Volume Profile Chart for 02/12/10

Friday, February 12, 2010

Friday 02/12/2010 - S&P 500 Futures Key Support/Resistance Levels

E-Mini S&P 500 Futures
Bulls have shown continued strength over the last couple of days. With the host of econ data coming out tomorrow, we could get strong movements in either direction. We have solid support areas below, and I would expect rotation on first touch. We also have well defined Resistance Areas above. There's an open gap at 1096.25, and that level could act as magnet if buyers continue pushing prices higher.

Econ Data
Retail Sales at 7:30 AM (cst), Consumer Sentiment at 8:55 AM (cst), Business Inventories at 9:00 AM (cst), EIA Natural Gas Report at 9:30 AM (cst), EIA Petroleum Status Report at 10:00 AM (cst), Treasury Budget at 1:00 PM (cst)

ES - Daily Chart with Volume Profile and Key Levels

Thursday, January 14, 2010

Thursday 01/14/2010 - E-Mini S&P 500 Futures Review/Analysis

E-Mini S&P 500 Futures Review/Analysis
I wasn't expecting such a narrow range day (8.75 points from Low to High). Only consolation is that narrow range days are typically followed by wide range days. I was using the 1141 level as Line in the Sand to establish directional bias (bullish above, bearish below). Most of the volume today was above 1141, and that level is still "in play". I was Long at 41.75 and exited in the 1145.25 area ahead of the IB High. We got a rotation back to the Initial Balance off the Initial Resistance Zone near the close.

ES 5-Minute Chart for 01/14/10

Key Support/Resistance Levels (S&P 500 Futures) for Thursday 01/14/2010

E-Mini S&P 500 Futures
As long as tomorrow's Econ releases don't throw off the current upside momentum, my bias will remain bullish above 1141. If we start moving higher, price could slice right through the Initial Resistance Zone without a retrace. On the downside, I'm anticipating a pause and rotation in the Initial Support Zone, followed by a pause in the 1128.50-1130.50 area. If that area breaks, we could see heavy selling. My scenario for tomorrow is anticipating a wide initial balance. If we're trading above the initial balance in the afternoon, I'm anticipating a return to balance prior to the close. If we break 1127, I would expect a trend day to the down side. Please note that this is just a scenario/framework, and actual trades will be based on reading price in real-time.

Econ Data
Retail Sales, Jobless Claims and Import and Export Prices at 7:30 AM (cst), Business Inventories at 9:00 AM (cst) and EIA Natural Gas Report at 9:30 AM (cst).

ES - Daily Bar Chart with Volume Profile and Key Levels

Friday, December 11, 2009

Key Levels & Scenarios (S&P 500) for Friday 12/11/2009

E-Mini S&P 500 (March 2010 Contract)
Volume shifted to the March 2010 ES contract towards the afternoon, and going forward, the key levels will be for the March contract. I was busy attending a technology event this evening, and didn't get home till later, which means less time for market analysis. I didn't have much time, but managed to put together some levels for the March contract.

1097.25-1099 is an accepted area at this point, so I'd like to see it hold for continued upside (currently trading at 1100.25). The initial resistance zone is 1103.50-1105.50 and initial support zone is 1093-1094.50. We have a few economic releases tomorrow morning which will probably result in quick volatile moves, so we could blow through the initial support/resistance zones in a hurry. If price is still trading around 1100, I would anticipate a bounce around 1090 and a pullback around 1110, on the econ release move. Make a note of the trend going into the economic release; don't overstay in the counter-trend move - price could reverse again and continue on its original path (trend). As long as you have a plan in place, you won't be shocked/surprised by the moves.

Retail Sales and Import and Export Prices out at 7:30 am (cst). Consumer Sentiment at 8:55 am (cst) and Business Inventories at 9:00 am (cst).

ES - Daily Bar Chart with Volume Profile and Key Levels


Crude (CLF10)
For Crude traders, here's how I'm seeing the levels on the Hourly chart for CLF10.

CL - Hourly Chart

Thursday, June 11, 2009

Thursday 06/11/09 - Indecisive Market

938.25, 936.50, 935.50, 934.75, 936.50 - those are the closing prices over the past 5 trading sessions. I realize the market is at an inflection point and really wish it would make up its mind already! With the recent price action, I'm afraid to buy break-outs and almost as afraid to short break-downs (refer to yesterday afternoon's 50% retracement back up).

My goal today was mostly to stay out of trouble on contract rollover day, and to get into a rhythm with my trading, i.e. get comfortable entering/exiting trades on the Live account. I may have over-done it, but I placed 27 trades today (6 on the ES and 21 scalps on the NQ). I don't usually trade the NQ but I keep a 5-min chart of NQ up to get a feel for sector participation on big moves. For example, ES was trading above it's 1st hour high in the afternoon session while NQ was trading below it's 1st hour high. I began scalping the NQ just to get comfortable entering/exiting the market, and the NQ doesn't really do much damage since it's a smaller contract. I ended positive on the NQ and ES but broke even on the day after commissions.

Some positive points from today:
1. I'm slowly getting a little better at executing trades with less hesitation. Still a looong way to go!
2. I added to a winning position in the NQ.
3. I was down $140 or so in the early afternoon and could have called it a day, but continued pressing on and made back the loss.

The main negative point from today was that I didn't hold on to my winners. I was short in NQ from 1503-1507 several times but after a few 2.5pt stop-outs, I got a little shy and started taking quick winners to get back to positive territory. I was short in the ES at 844.50 and 845ish late afternoon but didn't hold it long enough because I was afraid they would run it back up like they did yesterday. Considering ES was above it's 1st hour high till 2:25 PM (central), there was a chance that price could rally back into the close. It also bounced off the 945 area so many times.

Overall, I'm still down $267.50 on the week. I have to run some errands tomorrow so will only be trading the first couple of hours.

ES (5-Min)


ES (Daily)