Showing posts with label Contract Rollover. Show all posts

Friday, March 12, 2010

Friday 03/12/2010 - E-Mini S&P 500 Futures Review/Analysis

E-Mini S&P 500 Futures Review/Analysis
So the first move above 1150 got sold into; what a surprise (sarcasm). Price bounced ahead of the Overnight Support Level (1141.75), and was well accepted in the 1143.50-1146 area, closing above VWAP, Previous Close and the Day Session Midpoint. Aside from the overbought conditions, I'm not seeing any signs of weakness and price could very well continue moving north into next week. I'm open to a 2-3% pullback, but also can't close my mind to upside continuation. As day traders, we have to be prepared to take advantage of price movement in either direction. Have a great weekend!

ES 5-Minute Chart


ES 30-Min Volume Profile Chart

Friday 03/12/2010 - S&P 500 Futures Key Support/Resistance Levels

E-Mini S&P 500 Futures
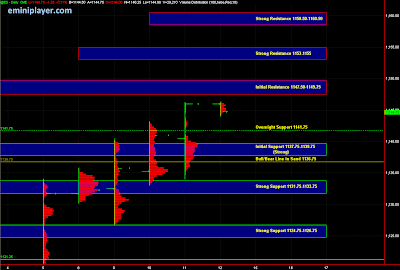
Price is getting very extended up here, and a breather would be a good thing at this point since it would allow Buyers to re-load at better prices, and may even attract additional capital currently on the sidelines. The challenge at this point is to keep the bearish bias in check, and view price objectively. My Bull/Bear Line in the Sand is 1136.75; bullish above and bearish below that level. Risk management is Key here since a move down could result in some profit-taking, which could trigger a stronger sell-off. Bears are waiting and will probably pounce on this thing at the earliest glimpse of a selling opportunity. Trade well!

Econ Data
Retail Sales at 7:30 AM (cst), Consumer Sentiment at 8:55 AM (cst), and Business Inventories at 9:00 AM (cst). Treasury Secretary Tim Geithner speaks before the U.S. Export-Import Bank annual conference in Washington at 11:00 AM (cst).

ES - Daily Chart with Volume Profile and Key Levels

Thursday, March 11, 2010

Thursday 03/11/2010 - E-Mini S&P 500 Futures Review/Analysis

E-Mini S&P 500 Futures Review/Analysis
What a day...Range-bound chop for better part of the day, followed by an unexpected rally into the close. Now, although I didn't anticipate the rally, I did manage to pick up on some clues that kept me from shorting it. Here's why I didn't short into the afternoon up move:
1. on the pullback, Price remained above mid-point
2. Price rejected VWAP (Support)
3. ES rebounded back to trading above the Initial Balance (1st Hr) High
4. Positive NYSE TICK Divergence
5. 1139-1140 was an area of acceptance

I put together the Levels last night in a hurry, but they still worked out pretty well and helped me obtain good trade location. The arrows marked on the 5-min chart for today are the trade sequences I took (Short, Long, Short). Lets hope the Retail Sales data out tomorrow morning shakes things up and brings some volatility back into the market.

In other news, I attended my last lecture at DePaul tonight! I have final exams next week and then I'm DONE! This past year has been really tough with full-time work, full-time school (5 classes), trading, blog, etc. and wrapping up school is such a relief! After next week, I'll finally be able to get some sleep :-)

ES 5-Minute Chart


ES 30-Min Volume Profile Chart


ES Day Session Volume Profile Chart

Thursday 03/11/2010 - S&P 500 Futures Key Support/Resistance Levels

E-Mini S&P 500 Futures
Due to homework & final exams, I didn't have time to prepare the detailed Key Levels chart tonight. I did a quick analysis of the June S&P E-Mini Futures and came up with the following S/R Levels:

Support: 1133.75, 1128.50, 1121.25, 1117.50 (open gap), 1114.25-1115.50, 1109-1111.

Resistance: 1139.25, 1141-1143, 1146.25-1148.25, 1152, 1156, 1160

Anticipating a pickup in volatility due to several Econ Releases out tomorrow morning (catalysts). Don't forget to rollover to the June contract (ESM10)!

Econ Data
International Trade amd Jobless Claims at 7:30 AM (cst), EIA Natural Gas Report at 9:30 AM (cst), 30-Yr Bond Auction at 12:00 PM (cst), Fed Balance Sheet and Money Supply at 3:30 PM (cst).

Wednesday, March 10, 2010

Wed. 03/10/2010 - E-Mini S&P 500 Futures Review/Analysis

E-Mini S&P 500 Futures Review/Analysis
Price bounced ahead of Overnight Support, and continued moving to the upside in the morning session, followed by range-bound conditions later in the day. ES closed above the mid-point, and close to the Initial Balance High, which I view as indication of continued strength. As I mentioned last night, aside from being overbought and extended, I'm not seeing any signs of weakness yet. At the same time, everyone knows we're due for a pullback, so have to keep the risk on Longs fairly tight up here. I just want the market to resolve this "area" and move on. I don't really care if it moves up or down, just move already!

Rollover
Don't forget to rollover to the June contract (ESM10) tomorrow!

ES 5-Minute Chart

Tuesday, March 9, 2010

Tuesday 03/09/2010 - E-Mini S&P 500 Futures Review/Analysis

E-Mini S&P 500 Futures Review/Analysis
StockTwits is a great tool to observe crowd behavior among the group of traders who post their market thoughts day in and day out (myself included), and you can see how having a strong bias can have an adverse affect on one's trading. Based on watching the $ES_F stream on StockTwits, you can see that a lot of short-term traders have been entering the market with a decidedly Bearish bias for the past few days. Now, I'm not saying their bias is right or wrong and the S&P 500 could easily pullback 2-3% but shorting every new high on up-trend days too early in the day is not only painful and frustrating but also keeps you out of profitable trade opportunities on the other side. I know that pain/frustration all too well since this used to be a BIG problem for me, and it's something I'm still working on but over time, it has become less of an issue. I wasn't around for the Long entry at Initial Support in the morning due to my daily meetings, but I also didn't enter short until price was trading in the 1142.50-1145 area. Btw, in a trending environment, the Key Levels also serve as potential target areas for trend trades, so in today's case the 1142.50-1144 Resistance Zone was a great place to scale out of Longs. Despite pulling back 9 handles from the day's high (1145.25), ES still managed to close on strength above the Mid-Point and Initial Balance High. At this point, I'm anticipating 1132-1136 to act as Stronger Support, which means if we break that area, we could see momentum pick up to the downside with a test of 1126.

ES 5-Minute Chart


ES 30-Min Volume Profile Chart


ES Day Session Volume Profile Chart

Tuesday 03/09/2010 - S&P 500 Futures Key Support/Resistance Levels

E-Mini S&P 500 Futures
With Monday being a consolidation day, the Key Levels haven't really changed much. We've built some short-term resistance in the 1138.25-1139.50, but if price gets back up in that area, I would anticipate a break-out above to tag higher resistance levels. In other words, I don't consider 1138.25-1139.50 to be Strong Resistance; it's just an obstacle that the market may have to work through if it moves back up. A pullback to the 1124-1126 area would not affect the near-term bullish bias. Actually, my goal for tomorrow is to trade with no bias, and just go with the momentum. I'll be monitoring price at the Key S/R Levels to gauge market strength/weakness. I'll also be paying attention to the opening gap; I feel the gap could provide short-term directional bias, i.e. we may continue in direction of the gap in the morning session. Come prepared, and trade well!

Econ Data
ICSC-Goldman Store Sales at 6:45 AM (cst), Redbook at 7:55 AM (cst)

ES - Daily Chart with Volume Profile and Key Levels

Monday, March 8, 2010

Monday 03/08/2010 - E-Mini S&P 500 Futures Review/Analysis

E-Mini S&P 500 Futures Review/Analysis
No surprises today. The scenario posted last night called for "a range-bound consolidation day with minor range extension to the upside" and the plan was to "buy the dips and short the upside moves"; which worked out well. 1137-1139 is Resistance at this point. Keep in mind, we're closing in on the Yearly Highs, so Resistance here should not be a surprise. At this point, even a pullback to 1117-1121 wouldn't change the short-term bullish stance of the market, IMO. Bears begin regaining control below 1112, with 1095-1103 being true test on the larger time frames. To put this in perspective, consider that a move down to 1100 is only -3% from current levels. Either way, we're close to an inflection point and volatility should return shortly once the market figures out its direction. Bias remains bullish until conditions change.

ES 5-Minute Chart


ES 30-Min Volume Profile Chart


ES Day Session Volume Profile Chart

Wednesday, December 9, 2009

Key Levels & Scenarios (S&P 500) for Thursday 12/10/2009

E-Mini S&P 500 (December Contract)
The levels haven't really changed much, so please refer to yesterday's Key Levels chart.

Upside
1099.75-1101.25 is still the initial resistance zone (good chance to tag it in Globex), with 1105.50-1108 as strong resistance above that area. After that, 1110 is the 100% range extension, which may also act as a temporary barrier to further upside.

Downside
On the down side, the initial support zone is 1091.25-1092.50, followed by 1085 and 1082.50. The support zones haven't really changed much.

Scenario
Today's VPOC was around 1092.50, and we closed on the highs so my near-term bias is bullish. International Trade and Jobless Claims data out at 7:30 am cst tomorrow morning. I'm anticipating a trend day with some conviction on direction. The plan is to be patient, identify the trend, and then enter in direction of trend on pullbacks. Even if the trend is up, taking short trades in the 1107-1110 area is a relatively safe bet. On the other hand, if the trend is down, I'd be cautious entering Long (counter-trend) at initial support (1091.25-1092.50) but anticipate a bounce in the 1082.50-1085 area. It's also contract rollover tomorrow, and volume will gradually shift from the December 2009 contract (ESZ09) to the March 2010 contract (ESH10) over the next couple of days. The support/resistance numbers I've mentioned above are for the December contract.

Thursday, June 11, 2009

Thursday 06/11/09 - Indecisive Market

938.25, 936.50, 935.50, 934.75, 936.50 - those are the closing prices over the past 5 trading sessions. I realize the market is at an inflection point and really wish it would make up its mind already! With the recent price action, I'm afraid to buy break-outs and almost as afraid to short break-downs (refer to yesterday afternoon's 50% retracement back up).

My goal today was mostly to stay out of trouble on contract rollover day, and to get into a rhythm with my trading, i.e. get comfortable entering/exiting trades on the Live account. I may have over-done it, but I placed 27 trades today (6 on the ES and 21 scalps on the NQ). I don't usually trade the NQ but I keep a 5-min chart of NQ up to get a feel for sector participation on big moves. For example, ES was trading above it's 1st hour high in the afternoon session while NQ was trading below it's 1st hour high. I began scalping the NQ just to get comfortable entering/exiting the market, and the NQ doesn't really do much damage since it's a smaller contract. I ended positive on the NQ and ES but broke even on the day after commissions.

Some positive points from today:
1. I'm slowly getting a little better at executing trades with less hesitation. Still a looong way to go!
2. I added to a winning position in the NQ.
3. I was down $140 or so in the early afternoon and could have called it a day, but continued pressing on and made back the loss.

The main negative point from today was that I didn't hold on to my winners. I was short in NQ from 1503-1507 several times but after a few 2.5pt stop-outs, I got a little shy and started taking quick winners to get back to positive territory. I was short in the ES at 844.50 and 845ish late afternoon but didn't hold it long enough because I was afraid they would run it back up like they did yesterday. Considering ES was above it's 1st hour high till 2:25 PM (central), there was a chance that price could rally back into the close. It also bounced off the 945 area so many times.

Overall, I'm still down $267.50 on the week. I have to run some errands tomorrow so will only be trading the first couple of hours.

ES (5-Min)


ES (Daily)