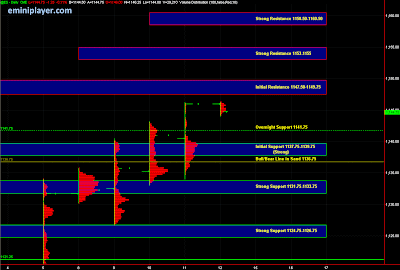
E-Mini S&P 500 (March 2010 Contract)Volume shifted to the March 2010 ES contract towards the afternoon, and going forward, the key levels will be for the March contract. I was busy attending a technology event this evening, and didn't get home till later, which means less time for market analysis. I didn't have much time, but managed to put together some levels for the March contract.
1097.25-1099 is an accepted area at this point, so I'd like to see it hold for continued upside (currently trading at 1100.25). The initial resistance zone is 1103.50-1105.50 and initial support zone is 1093-1094.50. We have a few economic releases tomorrow morning which will probably result in quick volatile moves, so we could blow through the initial support/resistance zones in a hurry. If price is still trading around 1100, I would anticipate a bounce around 1090 and a pullback around 1110, on the econ release move. Make a note of the trend going into the economic release; don't overstay in the counter-trend move - price could reverse again and continue on its original path (trend). As long as you have a plan in place, you won't be shocked/surprised by the moves.
Retail Sales and Import and Export Prices out at 7:30 am (cst). Consumer Sentiment at 8:55 am (cst) and Business Inventories at 9:00 am (cst).
ES - Daily Bar Chart with Volume Profile and Key Levels Crude (CLF10)
For Crude traders, here's how I'm seeing the levels on the Hourly chart for CLF10.
CL - Hourly Chart


