Showing posts with label EIA Petroleum Status Report. Show all posts

Wednesday, March 31, 2010

Wed. 03/31/2010 - E-Mini S&P 500 Futures Review/Analysis

E-Mini S&P 500 Futures
We got a solid bounce at Initial Support, but no follow-through above 1170. NYSE TICK Divergences provided some nice entries on both sides. At this point, the market is pretty much balanced between 1160 and 1170, and we need a catalyst to drive price out of this range.

ES 5-Minute Chart


ES Day Session Volume Profile Chart

Tuesday, March 30, 2010

Wed. 03/31/2010 - E-Mini S&P 500 Futures Key Support/Resistance Levels

E-Mini S&P 500 Futures
I'm going to continue using 1163.25 as my Bull/Bear Line in Sand, which means the current near-term bias is Bullish. Tomorrow is also the last day of the month, and the market has a tendency to be bullish in the afternoon session. It's a scenario I'm prepared for, so I will try to get more out any Long positions in the afternoon if I see Buy setups around that time. The morning could be choppy or even bearish. Be prepared, go in with a plan, and be mindful of trade location. Initiate trades where you feel comfortable and don't get caught up in the chop. Keep your bias in check. Everyone wants this market to drop, and it could drop tomorrow, or it could test the low 1180s. Trade well!

Econ Data
ADP Employment Report at 7:15 AM (CT), Chicago PMI at 8:45 AM (CT), Factory Orders at 9:00 AM (CT), and EIA Petroleum Status Report at 9:30 AM (CT).

ES - Daily Chart with Volume Profile and Key Levels

Wednesday, March 24, 2010

Wed. 03/24/2010 - E-Mini S&P 500 Futures Review/Analysis

E-Mini S&P 500 Futures
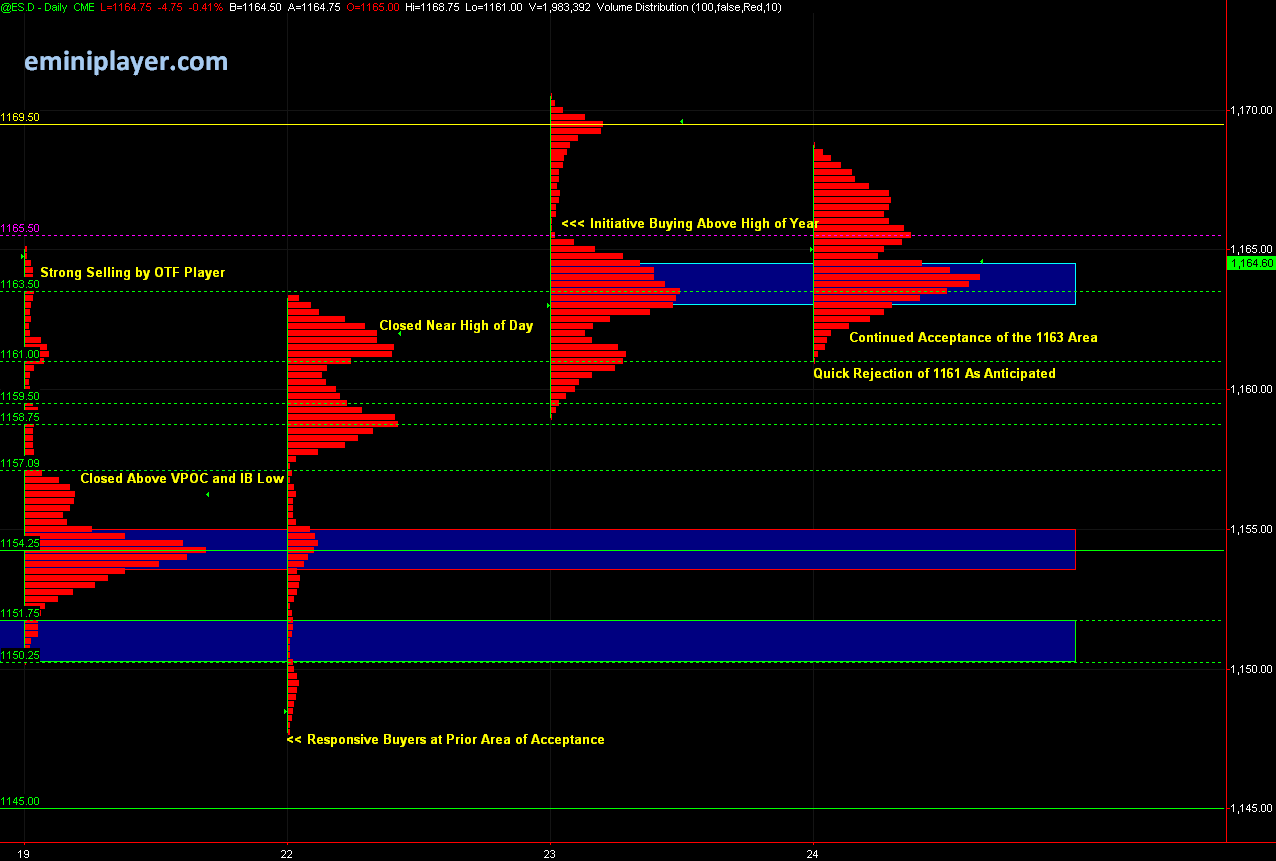
Last night's post called for a consolidation day with narrower range (8-10 points), which played out well today. The day session range was 7.75 points, and the 24-hour session range was 9 points. I was anticipating Responsive Buying at 1161, and that turned out to be the low tick of the day. We're continuing to build acceptance (volume) in the 1163.50-1164 area. I expect selling pressure below 1164, and buying pressure above it.

ES 5-Minute Chart


ES Day Session Volume Profile Chart

Wed. 03/24/2010 - S&P 500 Futures Key Support/Resistance Levels

E-Mini S&P 500 Futures
After Tuesday's late afternoon upside breakout, a test of the breakout level (1165.50) is expected; and it looks like we may even get it in overnight trading (ES currently trading at 1167). My plan for tomorrow is to buy the dips into the Key Support Areas, and Short the upside moves into Resistance. There wasn't much buying interest in the 1170-1170.50 area, and I'll be looking to Short it on first touch. I'd be cautious initiating Longs above 1170 since I'm anticipating significant rotation in the 1170-1180 area. If the break-out is "real", I would expect 1163 to hold; a break of 1158.50 would make me suspicious of this upside breakout move and we may get a stronger move down (failure of breakout). I'm expecting consolidation here, and a narrower range day (8-10 points).

Econ Data
Durable Goods Orders at 7:30 AM (CT), New Home Sales at 9:00 AM (CT), and EIA Petroleum Status Report at 9:30 AM (CT).

ES - Daily Chart with Volume Profile and Key Levels

Wednesday, March 17, 2010

Wed. 03/17/2010 - E-Mini S&P 500 Futures Review/Analysis

E-Mini S&P 500 Futures Review/Analysis
Strong up trend most of the day with a late afternoon pullback which was quickly bought up into the close. Market internals were strengthening all day, and resumed an upward slope into the close. The only signs of caution were TF, NQ and EMD closing below VPOC and Mid-Point. ES closed below the day session mid-point and IB High, and right at the VPOC. The market is still Bullish, but these signs are indicative of waning momentum.

ES 5-Minute Chart


ES 30-Min Volume Profile Chart


ES Day Session Volume Profile Chart

Wed. 03/17/2010 - S&P 500 Futures Key Support/Resistance Levels

E-Mini S&P 500 Futures
After the trend up day, the current plan is to buy the dips into Support on first touch and Short the Strong Resistance areas. The Bull/Bear Line in Sand is at 1144. Even though we're quite extended here (sounding like a broken record by now); tomorrow is setting up to be another Bullish day. Of course, things can change quickly when price is leaning too far on any one side (imbalance); but we have to trade it with the information we have in front of us. Price is currently trading in the Initial Resistance area and looks like it could head higher overnight. Trade well!

Econ Data
Producer Price Index at 7:30 AM (CT), EIA Petroleum Status Report at 9:30 AM (CT), Ben Bernanke Speaking before the Committee on Financial Services, U.S. House of Representatives on "Banking Supervision" at 1:00 PM (CT).

ES - Daily Chart with Volume Profile and Key Levels

Wednesday, March 10, 2010

Wed. 03/10/2010 - E-Mini S&P 500 Futures Review/Analysis

E-Mini S&P 500 Futures Review/Analysis
Price bounced ahead of Overnight Support, and continued moving to the upside in the morning session, followed by range-bound conditions later in the day. ES closed above the mid-point, and close to the Initial Balance High, which I view as indication of continued strength. As I mentioned last night, aside from being overbought and extended, I'm not seeing any signs of weakness yet. At the same time, everyone knows we're due for a pullback, so have to keep the risk on Longs fairly tight up here. I just want the market to resolve this "area" and move on. I don't really care if it moves up or down, just move already!

Rollover
Don't forget to rollover to the June contract (ESM10) tomorrow!

ES 5-Minute Chart

Tuesday, March 9, 2010

Wed. 03/10/2010 - S&P 500 Futures Key Support/Resistance Levels

E-Mini S&P 500 Futures
I'm busy with final exams/papers/projects (last two weeks of school here), so will keep the post brief. Aside from the market being overbought and extended up here, I'm not seeing any reason to be Bearish just yet. I believe everyone is fully prepared for a pullback, and that could very well be the reason no significant pullback has materialized (too many people shorting & covering up here). The S&P Futures closed on Strength today, and so far we're seeing continuation of that strength in overnight trading. I'm anticipating the 1132.75-1134.75 Area to provide Strong Support if the buying is to continue. My Bull/Bear Line in the Sand is 1132.75; bullish if price is trading above it, and bearish if price is trading below it. Trade well!

Econ Data
Wholesale Trade at 9:00 AM (cst), EIA Petroleum Status Report at 9:30 AM (cst), and Treasury Budget at 1:00 PM (cst).

ES - Daily Chart with Volume Profile and Key Levels

Wednesday, March 3, 2010

Wed. 03/03/2010 - E-Mini S&P 500 Futures Review/Analysis

E-Mini S&P 500 Futures Review/Analysis
As I mentioned in last night's post, that 1125-1128 area is heavy resistance, and that worked very well today with 1125 being the high of day (I shorted 1124.50). After that, it was orderly selling down to support (initial resistance area became new support area). Price then tested yesterday's high a couple of times, and sold off down to the Initial Support area. We got a nice bounce at Initial Support back to the 24-hr session midpoint with a close right above the Initial Balance Low. I'm still viewing this as consolidation and will continue using the 1112.50 level as my Bull/Bear Line in the Sand to establish bias. This is the second day in a row with price closing below the mid-point; a cautionary flag for the Bulls.

ES 5-Minute Chart


ES 30-Min Volume Profile Chart


ES Day Session Volume Profile Chart

Wed. 03/03/2010 - S&P 500 Futures Key Support/Resistance Levels

E-Mini S&P 500 Futures
It's already almost 2:30 AM here, so will keep the notes brief tonight. Currently, the Buyers are clearly in control but price is heading into a heavy area of resistance (1125-1128). In my opinion, that area will be the true test of market strength. But until then, bias is bullish. My bull/bear line in the sand to establish bias is 1112.50; Bullish above it, and bearish below it. Trade well!

Econ Data
ADP Employment Report at 7:15 AM (cst), ISM Non-Mfg Index at 9:00 AM (cst), EIA Petroleum Status Report at 9:30 AM (cst), Beige Book at 1:00 PM (cst).

ES - Daily Chart with Volume Profile and Key Levels

Wednesday, February 24, 2010

Wed. 02/24/2010 - E-Mini S&P 500 Futures Review/Analysis

E-Mini S&P 500 Futures Review/Analysis
Sorry if I sound repetitive, but the Scenario and Key Levels worked out great -- To the Tick on a few price swings. Price remained above 1100 for most of the day, and we got heavy acceptance (volume) in the 1103-1103.75 area. 1097 is an area of interest, and as long as price remains above it, we could see the buying continue into tomorrow.

ES 5-Minute Chart


ES 30-Min Volume Profile Chart


ES Day Session Volume Profile Chart

Tuesday, February 23, 2010

Wed. 02/24/2010 - S&P 500 Futures Key Support/Resistance Levels

E-Mini S&P 500 Futures
Bulls have a fighting chance as long as price remains above 1091 tomorrow. I know there's a lot of Bearish sentiment in the market right now, and we very well could head lower tomorrow, but I have to be open to both scenarios. Lets look at today's price action objectively: Price hit Resistance at 1112.75 and broke below the mid-point, VWAP and Initial Support Zone in the overnight session. So from a technical/charting perspective, we were already setup for some Selling going into the Consumer Confidence release. The negative Consumer Confidence # brought in the Other Time-Frame Seller and we sold off 11.75 points in 20 minutes and consolidated below the mid-point for remainder of the day. OK -- sounds pretty damn bearish, but then we got quick and repeated rejection of the 1090.75-1091.75 area (keep that area in mind for tomorrow), and price rotated above the IB Low and closed at the VWAP. I'd feel more confident on the Sell side if price had closed below the IB Low. As long as Initial Support holds tomorrow, I think we could see a rotation back to 1100+. Pending any news, I'm anticipating a range-bound, rotational day tomorrow where price reaches an area of Support or Resistance and rotates/chops back and forth before moving to the next area. Bias is Bearish below 1091, Bullish above 1102 and neutral to slightly bullish in between. Another Key Level to keep an eye on is today's IB Low at 1094; a break of that area tomorrow could take us back for a re-test of 1090-1091 quickly. Expecting Strong Responsive Buying ahead of the 1076-1077 area, if we get there. Best trading!

Econ Data
New Home Sales at 9:00 AM (cst), Ben Bernanke Semiannual Monetary Policy Report to the Congress, before the House Committee on Financial Services, U.S. House of Representatives at 9:00 AM (cst), EIA Petroleum Status Report at 9:30 AM (cst).

ES - Daily Chart with Volume Profile and Key Levels

Thursday, February 18, 2010

Thursday 02/18/2010 - E-Mini S&P 500 Futures Review/Analysis

E-Mini S&P 500 Futures Review/Analysis
The Key Levels and Scenario played out beautifully today! The 1094.25-1096.25 area even provided a nice bounce on the after-hours Fed rate announcement, which caused the ES to dump 10.25 points in a single 5-minute bar. I was expecting a pullback in that 1106-1107 area anyway, so I'm not too concerned about the after-hours drop. I see that quick move down as mostly hedging activity and will look towards tomorrow's Cash Open and Initial Balance for clarity on direction. Bias will be Bullish if ES holds 1093 Level in the overnight Globex session.

ES 5-Minute Chart for 02/18/10


ES 30-Min Volume Profile Chart for 02/18/10


ES Day Session Volume Profile Chart for 02/18/10

Wednesday, February 17, 2010

Thursday 02/18/2010 - S&P 500 Futures Key Support/Resistance Levels

E-Mini S&P 500 Futures
I was going over some of my posts from December, 2009 and here we are two months later with the S&P 500 trading in the same price area. Check out the Key Levels post for Tuesday 12/15/2009 and Thursday 12/17/2009 -- notice how the Key Levels from then and now coincide. You can also check out the Market Review/Analysis posts for 12/15/09 and 12/17/09 to get an idea of how price reacted last time we were trading in this area. My bias is bullish above 1198.75, bearish below 1094 and neutral to bullish in between. That being said, I'm anticipating rotation in the Strong Support/Resistance Areas regardless of direction.

Econ Data
Producer Price Index and Jobless Claims at 7:30 AM (cst), Leading Indicators and Philadelphia Fed Survey at 9:00 AM (cst), EIA Natural Gas Report at 9:30 AM (cst), and EIA Petroleum Status Report at 10:00 AM (cst).

ES - Daily Chart with Volume Profile and Key Levels

Sunday, February 14, 2010

Friday 02/12/2010 - E-Mini S&P 500 Futures Review/Analysis

E-Mini S&P 500 Futures Review/Analysis
Had a great time on Friday, although those afternoon pullbacks went a little deeper than I expected. On the late afternoon pullback, we had Mid-Point, VWAP, and IB High as Support, which provided a solid bounce with a close at the High of Day. Given the strong close, I'm anticipating continuation into the next trading session. It looks like price could have gone higher but ran out of time.

Btw, I will begin trading Crude in the near future so if I get time, I may post Key Levels and Review for Crude as well.

ES 5-Minute Chart for 02/12/10


ES 30-Min Volume Profile Chart for 02/12/10


ES Day Session Volume Profile Chart for 02/12/10

Friday, February 12, 2010

Friday 02/12/2010 - S&P 500 Futures Key Support/Resistance Levels

E-Mini S&P 500 Futures
Bulls have shown continued strength over the last couple of days. With the host of econ data coming out tomorrow, we could get strong movements in either direction. We have solid support areas below, and I would expect rotation on first touch. We also have well defined Resistance Areas above. There's an open gap at 1096.25, and that level could act as magnet if buyers continue pushing prices higher.

Econ Data
Retail Sales at 7:30 AM (cst), Consumer Sentiment at 8:55 AM (cst), Business Inventories at 9:00 AM (cst), EIA Natural Gas Report at 9:30 AM (cst), EIA Petroleum Status Report at 10:00 AM (cst), Treasury Budget at 1:00 PM (cst)

ES - Daily Chart with Volume Profile and Key Levels

Wednesday, February 3, 2010

Wed. 02/03/2010 - E-Mini S&P 500 Futures Review/Analysis

E-Mini S&P 500 Futures Review/Analysis
After yesterday's strong trend day, some consolidation was expected, and that's what we saw today. I was anticipating some range extension to the upside, but looks like the market is waiting on the Friday jobs report before making the next directional push.

ES 5-Minute Chart for 02/03/10

Tuesday, February 2, 2010

Wed. 02/03/2010 - No Key S/R Levels Tonight

E-Mini S&P 500 Futures
I have two mid-term exams tomorrow, so no time to do the Key Levels tonight. But considering the strong up-trend today, I would anticipate a pullback into support, followed by some range extension to the upside. We have 1103-1104 as Resistance above, and beyond that we could see a test of the 1109-1111 area. Below, we have initial support at 1091.75-1093.75.

Econ Data
ADP Employment Report at 7:15 AM (cst), ISM Non-Mfg Index at 9:00 AM (cst) and EIA Petroleum Status Report at 9:30 AM (cst)

Wednesday, January 27, 2010

Wed. 01/27/2010 - E-Mini S&P 500 Futures Review/Analysis

E-Mini S&P 500 Futures Review/Analysis
Typical range-bound movement ahead of FOMC, followed by some range expansion on the announcement. I've been posting that 1080.50 area as Strong Support this entire week, and so far, that area has proven to be a great place to get Long.

ES 10-Minute Chart for 01/27/10

Wed. 01/27/2010 - Euro FX Futures Review/Analysis

Euro FX (EUR/USD) Futures
So far, I'm really liking the price action in 6E. It's a trader's market offering swift swings in both directions. I traded the 6E today, and the Key was to keep losses small (that's true of trading any market though). The instrument offers more than enough entries, so I just focused on keeping losses to a minimum and re-entering at the next setup. The rest took care of itself. Going forward, I'll definitely be focusing on 6E in addition to ES.

EC/6E 10-Minute Chart for 01/27/10