Sunday, November 22, 2009

Key Levels (S&P 500) for Monday 11/23/2009

E-Mini S&P 500
As @Jediphone pointed out on StockTwits, 7 of the last 8 Monday's have been bullish with an average gain of 1.28% (source: Phil's Stock World). In doing my own research, I found that the Monday after OpEx Friday was bullish in October, and the Monday of Thanksgiving week in 2008 was bullish as well. It's something to keep in mind, but of course, trades should be initiated based off what the market tells you in real-time. Existing Home Sales data out at 9:00 am (cst) tomorrow morning.

Bullish Scenario
1089 (VPOC from Friday) is near-term support. On the up side, we have near-term resistance at 1095.25. I'm bullish above 1095.25. After that, we have range extension targets in the 1098.25-1099.25 area, which could act as short-term resistance. If price gets to that area, I would anticipate a test of 1100, but that's a good area to scale out of Longs, and re-load at better prices. Above 1100, 1102.50 is a level that could offer stronger resistance and provide a rotation back to the 1099-1100 area. Above 1102.50, 1106 is strong resistance, and we have an Open Gap at 1108.50. We're currently building value in the 1094 area.

Bearish Scenario
1089 is the Volume Point of Control from Friday, and price would need to get below that level for sellers to begin taking control. 1085.25 is the next level of support, and the line in the sand for me between bullish/bearish bias. Below 1085.25, my bias shifts to bearish and shorting bounces becomes the higher probability play, IMHO. If we get below 1085.25, we'll likely test 1082.50, and quite possibly even break below it to get to that 1076-1079 area. I would expect the sell off to really accelerate if we break below 1076. 1064 has been the final bearish target for several days now.

ES - Daily Bar Chart with Volume Profile and Key Levels

Saturday, November 21, 2009

OpEx Friday - 11/20/2009 Review

Friday played out beautifully, and the scenarios put together on Thursday night provided the preparation necessary to trade the price action in real-time. In the bearish scenario, a test of 1082.50 was anticipated below 1087, and we got that move in the overnight session at 6:10 am (cst): price hit a low of 1083.50, and closed at 1084.50 on the 5-min chart. I was anticipating a test of 1082.50, so not testing 1082.50 is also a valuable piece of information. That 5-minute candle at 6:10 am is a wide-range bar with heavy relative volume (heavy considering the time of day), and I would view it as a significant candle in terms of support/resistance. Mark the open/high/low/close of that bar - the levels could (and did) act as support/resistance in the near-term. Now observe the price action following that candle; price stabilized at the 1084.50 level and broke through the high of that significant candle (1087.50) at 7:30 am (cst). From there, price moved up and hit resistance at 1092.75 (Thursday's POC), and we then sold off all the way down to 1085.25 (78.6% retracement). What does this mean? Is it bullish or bearish? Well, lets see, if the sellers were really in control, I would expect a test of 1083.50, so score one for the bulls for halting the down move at 1085.25. Price then retraced back up to 1088 (a tick above the cash open at 1087.75), and sellers came in again, but this time, they could only push it to 1085.50. Again, if sellers were dominant, I would expect price to test the previous swing low at 1085.25. That didn't happen. Based off this information, I entered Long at 1086 with a 6-tick initial stop, which was moved to break-even once price broke above 1088. The stop was moved to 1088 (+2 pts) once price broke above the mid-point (1089.25). Price came within a tick of triggering the stop, and the exit was at 1090.00. Btw, I had a couple of other small trades prior to this one, but they were tiny winners (4-6 ticks), so I chose to detail out the setup that had some structure to it.

Options Expiration Friday
I checked out the chart from October's OpEx Friday (10/16/09), and see a lot of similarities between 10/16 and 11/20. I wasn't concerned with the absolute values/prices on each day; just the directional swings. Lets do a little compare & contrast between 10/16 and 11/20 and look at the similarities:
  1. Price sold off in the overnight session on Both days.
  2. Price retraced back up into the cash Open
  3. Price stalled and reversed within the first 30 minutes of the open. Price began reversing down at 8:45 am on 11/20, and at 8:55 am on 10/16. The exact times aren't really important, but it's an interesting coincidence.
  4. Price retraced back down on both days. Price broke below the Globex Low on 10/16, but wasn't able to get to the Globex Low on 11/20.
  5. Price then chopped around, and moved higher into the previous day's POC on 10/16 and 11/20.
  6. Price moved back down into the close, and the down swing began at almost the same times on both days.
Looking at price action for similar days in previous weeks/months is not a part of my trading plan. I just did this exercise because I saw many similarities. I don't know if there's any merit to looking at similar days in the past to get a heads-up on price movement, but I found this to be pretty interesting. If you have any thoughts on this, or have performed similar comparisons in the past, please post in the Comments section.

ES - 5-Min Chart (November 20, 2009)


ES - 5-Min Chart (October 16, 2009)

Thursday, November 19, 2009

Key Levels (S&P 500) for Friday 11/20/2009

E-Mini S&P 500
The bearish scenario put together yesterday worked out great this morning. I was anticipating the move below 1100 to be fast - and price dropped 13 points from 1100.75 to 1087.75 in the first half hour of market open (1088 level marked as strong support for a few days now). The 1088 support level held (a 1.50 pt poke below 1088 doesn't really invalidate that "area" IMO), and I'm still counting on that area to hold as support. Could price break below it and test 1082.50? Sure. But I would anticipate a bounce around 1087 on first touch tomorrow (if we get there). Buyers were very active between 1090 and 1091.50 today. The VPOC for today was around 1092.75, and price is currently building/accepting value above 1091. Lets also keep the big picture in mind (daily chart). From that perspective, today's down move is no big deal, and I would anticipate the bulls to actively defend the Key areas of support (1088, 1082.50, 1076).

ES - Hourly Chart (Downside break-out from Triangle)


Bullish Scenario
On the upside, we now have resistance in the 1197 area (anticipating that to hold on first touch), then minor resistanct at 1100, followed by stronger resistance around 1102.50. We also have an open gap at 1108.50 now, and I would anticipate a gap fill on a move above 1102.50.

Bearish Scenario
On the bearish side, I'm anticipating 1087 area to hold on first touch. Below that, we could test 1082.50. It's interesting that price closed at 1082.25 on last month's options expiration Friday. Anticipating 1082.50 to hold on first touch, at which point, shorting the bounce would be a safe play for re-test/potential break of 1082.50. Below 1082.50, we could get a quick move to 1079; and then a grind down to 1076.50 area. Anticipating 1076 area to hold as support on first touch (scale out of shorts, or reverse to Long for a scalp, or possibly more here). If the selloff is really nasty, we could even get to the ultimate downside target of 1064 (not anticipating a strong selloff).

ES - Daily Bar Chart with Fib Levels (Perspective!)


ES - Daily Bar Chart with Volume Profile and Key Levels


Crude
Don't have time to do the levels for Crude tonight.

Wednesday, November 18, 2009

Key Levels (S&P 500 and Crude) for Thursday 11/19/2009

E-Mini S&P 500
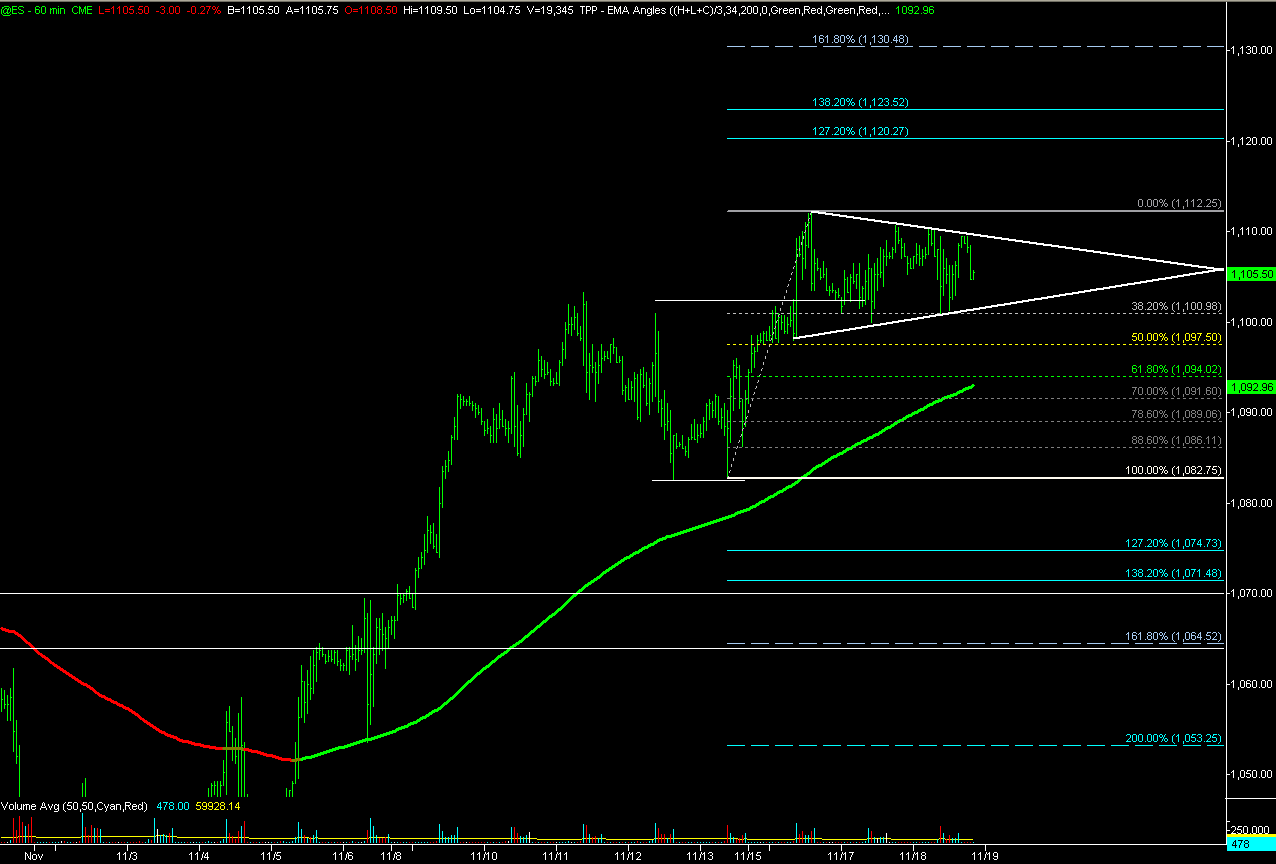
After yesterday's inside day, I was anticipating some range expansion today but all we saw was range-bound price movement. Maybe this is due to options expiration week? Who knows (who cares)? The levels were defined and price just bounced around within those areas. Today worked out great for scalpers, but if you were holding on to trades too long, anticipating range expansion, you probably scratched a lot of trades. In any case, price closed at 1108.50 (known level), with the VPOC/VWAP around 1105.75. Yesterday's VPOC was right around 1105 as well so keep an eye on that area. So far tonight, price hit a high of 1109.50 in the Globex session, and then pulled back to 1104 (1103.25 is previous week's high, and 1100 is near-term support). If you look at the 60-minute chart, you'll notice price is consolidating in a triangle, and it will break out of this formation sooner or later. On the upside, I'm eyeing the 1122 level and feel that price could test that level very soon. We've had two tight range days, so be open to larger moves in the coming day or two. Jobless Claims data out at 7:30 am (cst) in the morning.

Bullish Scenario
If we get a break-out to the upside, I would not Short against it until the momentum died down or we approached a big resistance area like 1120-1122. When price broke out above 1103.25 on 11/16, it ended up making its way all the way up to 1112.25 (9 pts higher). So, if we get a break out above 1112.25, could we again move up 9 points, to 1121.25 (oh so close to that 1122 level)? You bet! "Anything can happen at any time" - keeping that phrase in mind will allow you to be open to any and all possibilities instead of having the mindset where you Know what will price Will do. No one Knows!

Bearish Scenario
Looking at the Volume Profile chart, we can see that price has been building value higher over the past few days. We've established nice cushions of support from 1088 to 1100. But because we've established all this support, if/when price breaks down and we get a sell-off, the move could be fast & furious. A lot of Bulls will be put into Losing positions below 1088, and I see that as being the Key support level for the time being. Below that, we could go to 1076 fairly quickly, and finally 1064. I will rely on the 1100 support level until it's broken. Bullish above 1100, bearish below 1088.

ES - Hourly Chart with Price in a Triangle

ES - Daily Bar Chart with Volume Profile and Key Levels

Crude
The Crude (Dec contract) moved within the support and resistance zones defined in yesterday's CL Volume Profile chart. The 138.2% extension was at $80.34, and the high of day on Crude was $80.33 today. Crude also broke out of the bearish channel today. I'm anticipating near-term support in the $79 area, and strong support in the $78 area. Bullish above $79 and Bearish below $77.80.

CLZ9 - Daily Bar Chart with Volume Profile and Key Levels

Tuesday, November 17, 2009

Key Levels (S&P 500 and Crude) for Wednesday 11/18/2009

E-Mini S&P 500
ES broke out above 1103.25 yesterday so consolidation at these levels was anticipated today (11/17) - No surprises! The 1,100 level gained some strength as support today, but I'm still skeptical on it until price moves above 1112.25. Seeing confluence of support in the 1096.50-1098.75 area now though, and expecting that area to hold on first touch (good place to scale out of shorts and/or enter a low risk Long trade if price gets there). Near-term support at 1105, then 1100. Seeing a confluence of resistance in the 1111.50-1112.50 area and anticipating price to pause there on first touch (good place to scale out of Longs and/or enter a low risk short). Beyond that, we have 1114.50 and then 1118. 1122 is the 50% retracement of the entire down move from 1590s, so a lot of people will be watching that level.

Consumer Price Index and Housing Starts data out at 7:30 am (cst) in the morning. Anticipating range expansion tomorrow.

ES - 5 Min Chart from Tuesday 11/17/09


ES - Daily Bar Chart with Volume Profile and Key Levels

Crude
CL - Daily Bar Chart with Volume Profile and Key Levels