Showing posts with label Consumer Price Index. Show all posts

Thursday, March 18, 2010

Thursday 03/18/2010 - E-Mini S&P 500 Futures Review/Analysis

E-Mini S&P 500 Futures Review/Analysis
Price bounced off the Initial Support area in overnight trading, and stopped 1 tick ahead of the Overnight Resistance Level after the open. From there, we got a lot of narrow range chop, but price remained below 1162.50 and then broke below the IB Low. From there, we got a minor bounce ahead of Initial Support, which was sold into pushing price 1 tick below Initial Support. Price formed a double-bottom at Initial Support and went on to test the IB Low and ended up closing above the mid-point and VPOC, but below the Overnight Resistance. The fact that price couldn't even test the overnight resistance during the day session signals weakness. Market internals closed on weakness as well, and we may finally get that pullback everyone's been anticipating for days now. Price is currently in a neutral area, and built some acceptance in the 1159-1161 area over the last two days. I'll chalk up the choppy price action this week to quadruple witching and the fact that we're at new yearly highs, so consolidation is to be expected. Next week should be more happening (keeping fingers crossed)!

ES 5-Minute Chart


ES 30-Min Volume Profile Chart


ES Day Session Volume Profile Chart

Wednesday, March 17, 2010

Thursday 03/18/2010 - S&P 500 Futures Key Support/Resistance Levels

E-Mini S&P 500 Futures
The Bull/Bear Line in Sand for tomorrow is 1154. Based on the recent price action and market internals/breadth, the near-term bias is Bullish. The challenge in this kind of market is to keep the personal bias in check, and read the market with an open mind. Can the market fall 15-20 points tomorrow? Sure could, but I'm not going to close my mind to a possible move into the upper 1170s. Both scenarios are possible, and as day traders, we must keep the bias in check and trade what's in front of us. If you get good trade location on your Short positions, take advantage of it and try to hold for a larger move down. Tomorrow's focus will be the Jobless Claims data out at 7:30 AM (CT); so the best trade location may only be available in pre-market.

Econ Data
Consumer Price Index and Jobless Claims at 7:30 AM (CT), Leading Indicators and Philadelphia Fed Survey at 9:00 AM (CT), and EIA Natural Gas Report at 9:30 AM (CT).

ES - Daily Chart with Volume Profile and Key Levels

Sunday, February 21, 2010

Friday 02/19/2010 - E-Mini S&P 500 Futures Review/Analysis

E-Mini S&P 500 Futures Review/Analysis
I was anticipating Responsive Buyers to push price back up, which worked out very well on Friday. The breakout above the IB High around 10:10-10:15 AM (cst) was a clue that Buyers were in control, and the S&P could tag a higher area of Resistance. I avoided the Short side until price reached the Range Extension area, and then initiated a Short at 1110.00. As I've mentioned before on the blog, I view all price action as information. When price slices right through an area marked as "Strong Resistance" -- that is a Key piece of information and is indicative of strength. That Key piece of information kept me from shorting too early. Any information that keeps me out of bad trades, is just as valuable as information that gets me into the good ones.

ES 5-Minute Chart for 02/19/10


ES 30-Min Volume Profile Chart for 02/19/10


ES Day Session Volume Profile Chart for 02/19/10

Friday, February 19, 2010

Friday 02/19/2010 - S&P 500 Futures Key Support/Resistance Levels

E-Mini S&P 500 Futures
Anticipating Responsive Buyers to come in tomorrow morning. My bias is bullish above 1090 and bearish below. Tomorrow is also options expiration, so be flexible and go with the momentum. Check out the Review/Analysis from December's OpEx on Friday 12/18/2009 if you'd like to get an idea of the type of moves we may see tomorrow. The prices now are about the same as December as well.

Econ Data
Consumer Price Index at 7:30 AM (cst)

ES - Daily Chart with Volume Profile and Key Levels

Friday, January 15, 2010

Friday 01/15/2010 - E-Mini S&P 500 Futures Review/Analysis

E-Mini S&P 500 Futures Review/Analysis
As I posted last night, the 1141 level was my Line in the Sand to establish directional bias, and it served me well today. My bias was bearish at the open because price had broken down through 1141 as well as Initial Support in overnight trade, and the cash open at 1143 was below previous day's close and in the middle of yesterday's Initial Balance. A break of the 1139.75-1141 area confirmed that sellers were in control. Price also pushed right through the 1135-1137 Support Zone, which was also a sign of aggressive sellers and more selling to follow. Price finally stabilized around 1128.50 (strong support), but only after stopping out the traders who got Long too early in hopes to catch the bottom. It was much better and easier on the nerves to wait, buy the pullback, and trade the rotation back to the IB Low -- I posted this setup/scenario on StockTwits at 12:58 PM (Eastern). Given the weak close below the Initial Balance Low, we could see some continued selling into the next trading session.

Hope you all did great today! I'm off to the Chicago Premier of FLOORED. Have a good weekend!

ES 5-Minute Bar Chart for 01/15/10

Thursday, January 14, 2010

Key Support/Resistance Levels (S&P 500 Futures) for Friday 01/15/2010

E-Mini S&P 500 Futures
I will continue to use 1141 as Line in the Sand to establish directional bias; bullish above and bearish below it. As long as we remain above 1141, I'm anticipating a test of 1150.50, followed by a pullback. Beyond 1150.50, I would expect a test of 1155.25, and finally the 1159 area. 1128 is still the Big # below, although we now also have some firm support in the 1135-1136 area as well. The estimated daily range for tomorrow is 13.50-17.75 points.

Econ Data
Consumer Price Index and Empire State Mfg Survey at 7:30 AM (cst), Industrial Production at 8:15 AM (cst), and Consumer Sentiment at 8:55 AM (cst).

ES - Daily Bar Chart with Volume Profile and Key Levels

Wednesday, December 16, 2009

Wed. 12/16/2009 - S&P 500 Futures Market Review

E-Mini S&P 500 Futures
FOMC didn't generate the magnitude of price movement I anticipated, perhaps due to the quadruple witching this Friday, but still offered a couple of nice opportunities if you were patient, and entered trades at key levels. Price went through my initial resistance zone (1105.50-1107) during the overnight Globex session and hit a high of 1112. Price couldn't even extend to reach the 1112 Globex High in the Day Session (weakness) though. Price tested the Initial Balance High on the FOMC release, and sold off from there. If you used the mid-point and VWAP to establish bias, you either banked some profits, or at the very least, escaped with a small loss. There were a few reasons to scale out or exit in the 1103-1103.75 area. Selling shut off right at the 1103 Globex Low.

ES 5-Minute Chart for 12/16/09 Includes Overnight Globex

Key Levels & Scenarios (S&P 500 Futures) for Wednesday 12/16/2009

E-Mini S&P 500 Futures
Consumer Price Index and Housing Starts data out at 7:30 AM (cst), and the FOMC Meeting Announcement at 1:15 PM (cst). I'm anticipating range expansion in the afternoon. Many times price will move violently in both directions on the FOMC release. Use the Mid-Point and VWAP/VPOC as your line in the sand to establish bias. On the upside, expecting buying to shut off in the 1117.50-1119 area. On the downside, anticipating selling to shut off in the 1092-1094 area. These are just some rough targets; anything goes! If you're a relatively new trader, best option may be to just observe and absorb the price action so you're better prepared for the next FOMC day. Bias remains bullish above 1100, bearish below it but have to be cautious on the Long side as well since the 60-min chart is currently in a down-trend (possible change in trend above 1109.50). Trade well!

ES - Daily Bar Chart with Volume Profile and Key Levels

Wednesday, November 18, 2009

Key Levels (S&P 500 and Crude) for Thursday 11/19/2009

E-Mini S&P 500
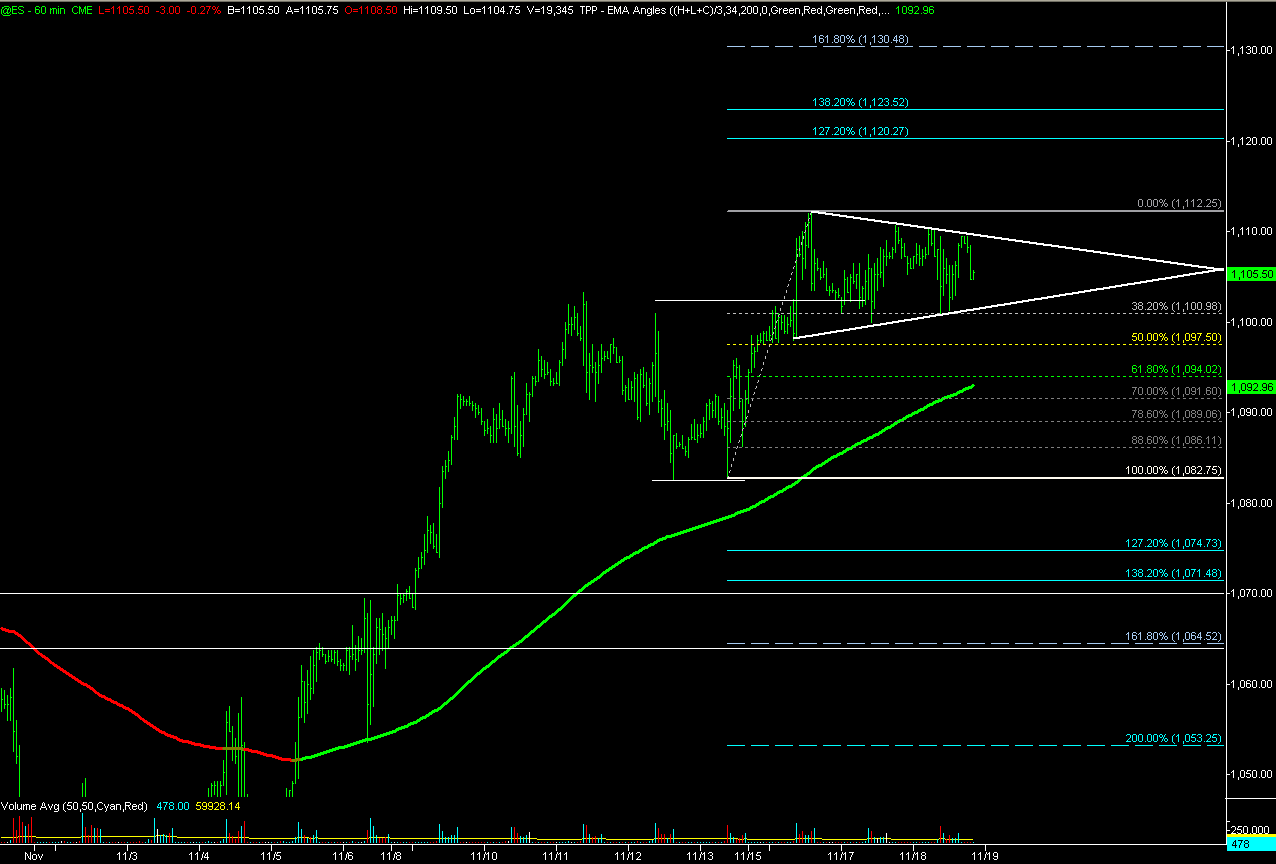
After yesterday's inside day, I was anticipating some range expansion today but all we saw was range-bound price movement. Maybe this is due to options expiration week? Who knows (who cares)? The levels were defined and price just bounced around within those areas. Today worked out great for scalpers, but if you were holding on to trades too long, anticipating range expansion, you probably scratched a lot of trades. In any case, price closed at 1108.50 (known level), with the VPOC/VWAP around 1105.75. Yesterday's VPOC was right around 1105 as well so keep an eye on that area. So far tonight, price hit a high of 1109.50 in the Globex session, and then pulled back to 1104 (1103.25 is previous week's high, and 1100 is near-term support). If you look at the 60-minute chart, you'll notice price is consolidating in a triangle, and it will break out of this formation sooner or later. On the upside, I'm eyeing the 1122 level and feel that price could test that level very soon. We've had two tight range days, so be open to larger moves in the coming day or two. Jobless Claims data out at 7:30 am (cst) in the morning.

Bullish Scenario
If we get a break-out to the upside, I would not Short against it until the momentum died down or we approached a big resistance area like 1120-1122. When price broke out above 1103.25 on 11/16, it ended up making its way all the way up to 1112.25 (9 pts higher). So, if we get a break out above 1112.25, could we again move up 9 points, to 1121.25 (oh so close to that 1122 level)? You bet! "Anything can happen at any time" - keeping that phrase in mind will allow you to be open to any and all possibilities instead of having the mindset where you Know what will price Will do. No one Knows!

Bearish Scenario
Looking at the Volume Profile chart, we can see that price has been building value higher over the past few days. We've established nice cushions of support from 1088 to 1100. But because we've established all this support, if/when price breaks down and we get a sell-off, the move could be fast & furious. A lot of Bulls will be put into Losing positions below 1088, and I see that as being the Key support level for the time being. Below that, we could go to 1076 fairly quickly, and finally 1064. I will rely on the 1100 support level until it's broken. Bullish above 1100, bearish below 1088.

ES - Hourly Chart with Price in a Triangle

ES - Daily Bar Chart with Volume Profile and Key Levels

Crude
The Crude (Dec contract) moved within the support and resistance zones defined in yesterday's CL Volume Profile chart. The 138.2% extension was at $80.34, and the high of day on Crude was $80.33 today. Crude also broke out of the bearish channel today. I'm anticipating near-term support in the $79 area, and strong support in the $78 area. Bullish above $79 and Bearish below $77.80.

CLZ9 - Daily Bar Chart with Volume Profile and Key Levels

Friday, May 15, 2009

Friday 05/15/09 - No Trades

Turned 26 today, and decided to sleep in since I was up till 2 AM last night finishing some web dev work, and late night reading (check out the Success and Motivation post on Mark Cuban's Blog). As mentioned in yesterday's post, Max Pain Theory predicted price to be in the $87 area for SPY (870s for S&P500 Index). I don't really have much faith in Max Pain, but it's good for entertainment value, and price did come down to 876.75, so maybe I should continue to track it over the next few months and see if it's worth a look. I was busy with web development a good part of the week, and trading was not the main focus. I plan on wrapping up the Web Dev stuff over the weekend so I can focus on trading next week. Ended the week with a net gain of +17.25 pts trading 3 out 5 days, with one of those days dedicated to experimentation. I have high hopes for next week's results.


ES (Daily) - Price still within bullish channel, and 876 low from 05/04/09 was held today.