Showing posts with label Construction Spending. Show all posts

Thursday, April 1, 2010

Thursday 04/01/2010 - E-Mini S&P 500 Futures Review/Analysis

E-Mini S&P 500 Futures
Some nice action in the S&Ps today. As I mentioned in yesterday's review, we've observed Responsive Buying and Responsive Selling all week, and today was much of the same. Responsive Sellers quickly rejected higher prices, and once price moved below 1167, Responsive Buyers quickly pushed price back up. 1167-1169 was the Area of heavy acceptance this week. This up move is losing momentum though. The previous week's high was 1176.50, and the high for this week so far is only one handle higher at 1177.50. If price gets below 1158, and longs begin liquidating, we could easily get a pullback to the 1139-1141 area.

Btw, I've received questions regarding the arrows on the 5-Minute charts I post in the daily reviews. To clarify, the arrows are NOT plotted automatically. I manually place those arrows on the charts where I see good setups (a lot of times within the Key Areas posted the night before). Some of the arrows are actual trades that I took (e.g. I shorted 1177 and went long at 1167 today). But not all of them are my trades. I don't plot all my trades on the 5-minute chart; just the setups. Hope that clears things up.

The markets are closed tomorrow for Good Friday, so enjoy the day off and have a good weekend!

ES 5-Minute Chart


ES Day Session Volume Profile Chart

Wednesday, March 31, 2010

Thursday 04/01/2010 - E-Mini S&P 500 Futures Key Support/Resistance Levels

E-Mini S&P 500 Futures
The current range for the WEEK is 12.50 points (1161.25-1173.75)! We've built acceptance between 1167.75 and 1169.75, and every move above and below that area has been met with Responsive Buying and Responsive Selling. We need a catalyst to drive this market outside of this range, at which point, I would anticipate some Initiative Activity. Tomorrow could be a trend day when price finally pushes to 1150 or 1183...or we could just get more of the same (chop). When everyone gets complacent (comfortable) within the current range, we'll probably get a surprise move that will force one party (either buyers or sellers) to liquidate their positions. As long as we hold above 1163, my bias remains (cautiously) to the upside. Trade well!

Econ Data
Motor Vehicle Sales, Jobless Claims at 7:30 AM (CT), Construction Spending and ISM Mfg Index at 9:00 AM (CT), EIA Natural Gas Report at 9:30 AM (CT).

ES - Daily Chart with Volume Profile and Key Levels

Monday, March 1, 2010

Monday 03/01/2010 - E-Mini S&P 500 Futures Review/Analysis

E-Mini S&P 500 Futures Review/Analysis
As noted in the Key Levels & Scenario post, the first day of March is historically bullish. Looking at the 30-Min Volume Profile chart, we can see a quick rejection of the 1106.75-1108 area within the first hour of trading. From there, we saw heavy acceptance in the 1112.50-1114 area, followed by a minor upside extension that was met with Resistance. Anticipating 1109 to act as support in the overnight session.

ES 5-Minute Chart


ES 30-Min Volume Profile Chart


ES Day Session Volume Profile Chart

Sunday, February 28, 2010

Monday 03/01/2010 - S&P 500 Futures Key Support/Resistance Levels

E-Mini S&P 500 Futures
Historically, the first day of March has been Bullish. On top of that, last week closed on a bullish note, with Buyers clearly in control. The obvious expectation is continuation to the upside. The upper price target for tomorrow is 1113. On the flip side, if price starts heading lower, we have to observe whether Responsive Buyers are stepping in and adding to their Long positions; or liquidating. My Bull/Bear Line in the Sand is 1095, which also happens to be the downside target if price begins heading lower. Anticipating 1095 to hold tomorrow. In the event that price breaks below 1095 on heavy volume, we could see heavier liquidation by the Buyers, and Initiative activity by the Sellers -- in which case, 1087.50 and 1084.50 would be the Key Levels to watch. Good luck, and best trading!

Econ Data
Personal Income and Outlays at 7:30 AM (cst), ISM Mfg Index and Construction Spending at 9:00 AM (cst).

ES - Daily Chart with Volume Profile and Key Levels

Monday, February 1, 2010

Monday 02/01/2010 - E-Mini S&P 500 Futures Review/Analysis

E-Mini S&P 500 Futures Review/Analysis
Had a very good day in the S&Ps. The Scenario and Key Levels posted last night worked out great: range-bound market in the morning session followed by an upward trend in the afternoon session. I had a couple of scratched trades, but no losing trades and managed to stay on the right side of the market all day. Looking forward to jumping into trading on a full-time basis in a couple of months!

ES 5-Minute Chart for 02/01/10

Sunday, January 31, 2010

Monday 02/01/2010 - S&P 500 Futures Key Support/Resistance Levels

E-Mini S&P 500 Futures
After the heavy selling we saw last week, a technical bounce should not come as a surprise. We have an Open Gap below at 1061.75, which could act as a magnet. Historically, the first day of February is bullish, and Monday's have also been bullish lately. I'm anticipating range-bound activity during the morning session, followed by a trend developing into the afternoon session. I will be looking for Shorting opportunities in the Resistance Zones and Buying opportunities in the 1059.75-1062.50 Zone, and the other Support Zones below. My current bias is bullish going into tomorrow. Use Globex Low as Initial Support. Even better if Globex Low happens to be within my Initial Support Zone of 1066.25-1068. Trade well!

Econ Data
Personal Income and Outlays at 7:30 AM (cst), ISM Mfg Index and Construction Spending at 9:00 AM (cst).

ES - Daily Chart with Volume Profile and Key Levels

Monday, January 4, 2010

Monday 01/04/2010 - E-Mini S&P 500 Futures Review/Analysis

E-Mini S&P 500 Futures Review/Analysis
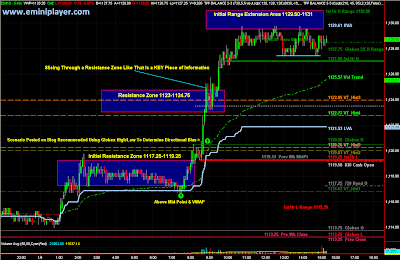
Today's 19 point range is well below the average, but ES still managed to tag the Initial Range Extension Zone. The bias was Long above the Globex High, and that played out well. If you did not trade on the Long side today, I would recommend you make a critical assessment of your personal bias. From a structural stand-point, a Short trade did not set up at any point throughout the day. Structurally, the up trend remained strong, and Shorts (if any) were *scalps* only.

Today's wide-range day could result in some additional consolidation in the 1120-1129 area. I'm anticipating continuation of the up-trend into tomorrow, and bias is bullish above 1123.

ES 5-Minute Chart for 01/04/10 Includes Overnight Globex
ES 5-minute Chart

Key Support/Resistance Levels (S&P 500 Futures) for Monday 01/04/2010

First of all, welcome to 2010 and I wish everyone the best!

Just an FYI -- tomorrow is the beginning of my last quarter at school, and I'm enrolled in five classes! This is in addition to a full-time job, so my schedule will be pretty crazy. I'm not sure if I'll be able to post the Key Levels and Scenarios every night, but will try to keep up with it. I graduate in March :)

E-Mini S&P 500 Futures
I'm anticipating a wide-range volatile trading day tomorrow. The average range of the first session of the year is 29.75 points, which means if we break out, we could tag the 1135-1142 area, and if we sell off, we could easily see the 1094s or even 1086s tomorrow. I'm anticipating a strong trend swing in the afternoon session. Please note that just because price has behaved a certain way in the past does not mean it WILL behave similarly tomorrow, but we can anticipate and prepare for the moves. Trades should be taken based on real-time market generated information.

The range expansion potential is pretty strong so I had to take two snapshots of the Key Levels chart to show the upside and downside support/resistance areas. I'd love to elaborate more on my thoughts for tomorrow, but it's already past 12:30 AM and I need to be up in 5 hours. Use the Overnight (Globex) High/Low to determine bias during the day session.

ISM Mfg Index and Construction Spending data out at 9:00 AM (CST) tomorrow morning. Trade well!

ES - Daily Bar Chart with Volume Profile and Key Levels

Upside Key Levels


Downside Key Levels

Monday, November 30, 2009

Key Levels and Scenarios (S&P 500) for Tuesday 12/01/2009

E-Mini S&P 500
Scenario and levels played out beautifully today...very structured moves and consolidation at known levels. Today's price action helped solidify the support in the 1082.50-1086 area. We can discern two things from that: 1) We'll probably get a bounce on first touch and 2)If price breaks through support, anticipate a fast move down to the extension targets. Monday's range was also within the top half of Friday's range (bullish). Price is currently at 1095.50 and building value above Monday's VWAP (1091). 1089.50-1091.25 is strong support at this point and I'm anticipating a bounce on first touch. My immediate bias as of this writing (11 PM CST) is bullish.

Redbook data out at 7:55 AM (cst) and ISM Mfg Index, Construction Spending and Pending Home Sales Index out at 9:00 AM (cst). Monday was an inside day. We've consolidated and accepted value here. Anticipating range expansion tomorrow!

Bullish Scenario (above 1089)
My bias will remain bullish as long as price remains above 1089. From here, I'd like price to break through that 1098 level, and test 1101.75. We may get some consolidation in the 1101.75-1103.25 zone, but if we break above 1101, I would anticipate a test of the 1106-1108 (a lot going on there). That would be a great place to scale out of a Long position, or if you're adventurous, even reverse to the short side for a rotation down to 1104-1105. Beyond 1108, the 1110-1112 is solid resistance. If price manages to crack above that level, which is possible, tagging 1115 shouldn't require too much effort.

Bearish Scenario (below 1089)
I will not consider shorts unless price breaks below 1089. That is an important area IMO, and if the market is truly gaining steam, the level should hold. At a minimum, I'm anticipating a bounce on first touch in the 1089.50-1091.25 area. If price bounces and starts heading down again, entering short with a tight stop would be a good risk/reward setup. If we break 1089, we could go down to 1082.50 in a hurry, and to 1079.25 below that. Again, the safer play would be to short the bounces from that point on. We have strong support in the 1076-1078 area so scaling out ahead of that would be prudent.

ES - Daily Bar Chart with Volume Profile and Key Levels

Monday, June 1, 2009

Monday 06/01/09 - Break Out

I'll start today's post with the Stats, and then briefly go over some of today's good and bad points:
# of Trades 17
Longs 15
Shorts 2
% Break-Even: 11.76
% Win 47.06
% Loss 41.18
Avg Win 1.38
Avg Loss -0.86
Largest Win (pts) 2.50
Largest Loss (pts) -1.50
Total Win (pts) 11.00
Total Loss (pts) -6.00
Net Gain/Loss (pts) 5.00
ES Daily Range 17.75
P/L as % of Daily Range 28.17

I'll go over the good points first: Avg Win was greater than Avg Loss, Largest Win was greater than Largest Loss, and finally almost 90% of today's traders were in direction of Trend. It was also nice seeing price hit 943 since that's been the expected target on this up swing for a few weeks now (refer to the Daily price charts posted over the last few weeks).

Now to the mistakes:

I entered Long at 943.25 on a Buy Stop at 10:59 AM (central); price moved up to 943.75, and then retraced down to 941.75, stopping me out at a -1 pt loss in the process. I wasn't monitoring the sectors or might have noticed the lack of participation from XLF. The monitoring of sectors resulted in a lot of missed trades over the last couple of weeks, so I figured I'd keep it simple today and was just using the 610 tick and 5-min chart. I think I should probably keep an eye on the key sectors such as XLF and XLE, but not utilize them to base specific entries/exits. It was also close to lunch time so perhaps I should've been more careful. Regardless, no big deal, it was just a -1 pt loss.

I then bought the break out again around 11:35 AM using a Buy Stop at 844.25. The 5-min chart printed a couple of dojis, and I had a couple of opportunities to exit at break-even, but I kept holding. I wasn't watching the 1-min NYSE $TICK or would have noticed the very obvious negative divergence when price retraced a bit and then moved back up to 944.50 (price moved higher while $TICK printed a lower high). The multiple dojis should also have served as a warning sign to get out at break-even when the market gave me the chance. I took this same trade later in the afternoon, and exited for a +2 pt profit but the difference was HOW price moved into that 944 area the second time around. The first time, it moved up on weak momentum, whereas, the second time around, the momentum was fairly strong, and the trade worked out. Momentum is Key for short term trading, IMHO.

All in all, an educational day (like every other trading day), and at least I was able to end it in the black. I have two of my friends coming over tomorrow for some group trading education/mentoring, so that will be tomorrow's focus.

Pending Home Sales Index out at 9:00 AM (central) tomorrow. Expecting support at 928.25-932.00; resistance at 947.25 and 955.50. At this point, looking for 916.50 to hold on a closing basis for up-trend to continue. Also need to be aware of open gap at 918.00

I'll end today's post with the following image highlighting Chuck's mantra (refer to comments from Thursday's post, definitely worth a read)

Monday, May 4, 2009

Monday 05/04/09 - ES Over 900 (Finally!)

I've been expecting (hoping for) a break above 900 for a while, so it's good to see it finally materialize. Unfortunately, price didn't pullback much so it was tough finding a good area to buy. If you didn't buy on the pullback to 889, you were left trading consolidation chop. My problem is, after ES makes a big up move, I have a hard time entering Long because I feel like price is "too high" and will reverse on me. Price has reversed hard so many times off the intraday high in the past few weeks, that it's a little scary buying above the first hour high; especially when price is so close to 900, which a lot of people perceive as a psychological barrier or resistance zone. Bottom line is, I need to set my biases aside and trade price. As day traders, we don't buy/sell value so the specific price shouldn't matter. We trade momentum. So as long as momentum is supporting the direction of my trade, I shouldn't be afraid to get in. Here's how today broke down in terms of performance across 18 trades:

% Break-Even: 31.58%
% Win 47.37%
% Loss 21.05%
Avg Win 1.00
Avg Loss -0.425
Largest Win (pts) 2.00
Largest Loss (pts) -1.50
Total Win (pts) 9.00
Total Loss (pts) -4.25
Net Gain/Loss (pts) +4.75

At this point, I'm looking for 879 to hold as support on a pullback.

I'll post a marked up 610 tick bar trade chart; it doesn't have all of my trades, just the ones I had time to mark in real-time. I'm using Infinity's execution platform so the trades aren't auto-plotted on my TradeStation charts now.

ES 610 Tick Bar Chart (Morning Trades)


ES 610 Tick Bar Chart (Afternoon Trades)


ES/$TICK (3-Min) - Open Gap at 876.50


ES (60 Min) - Looking for 879-886.75 as an area of support on a pullback